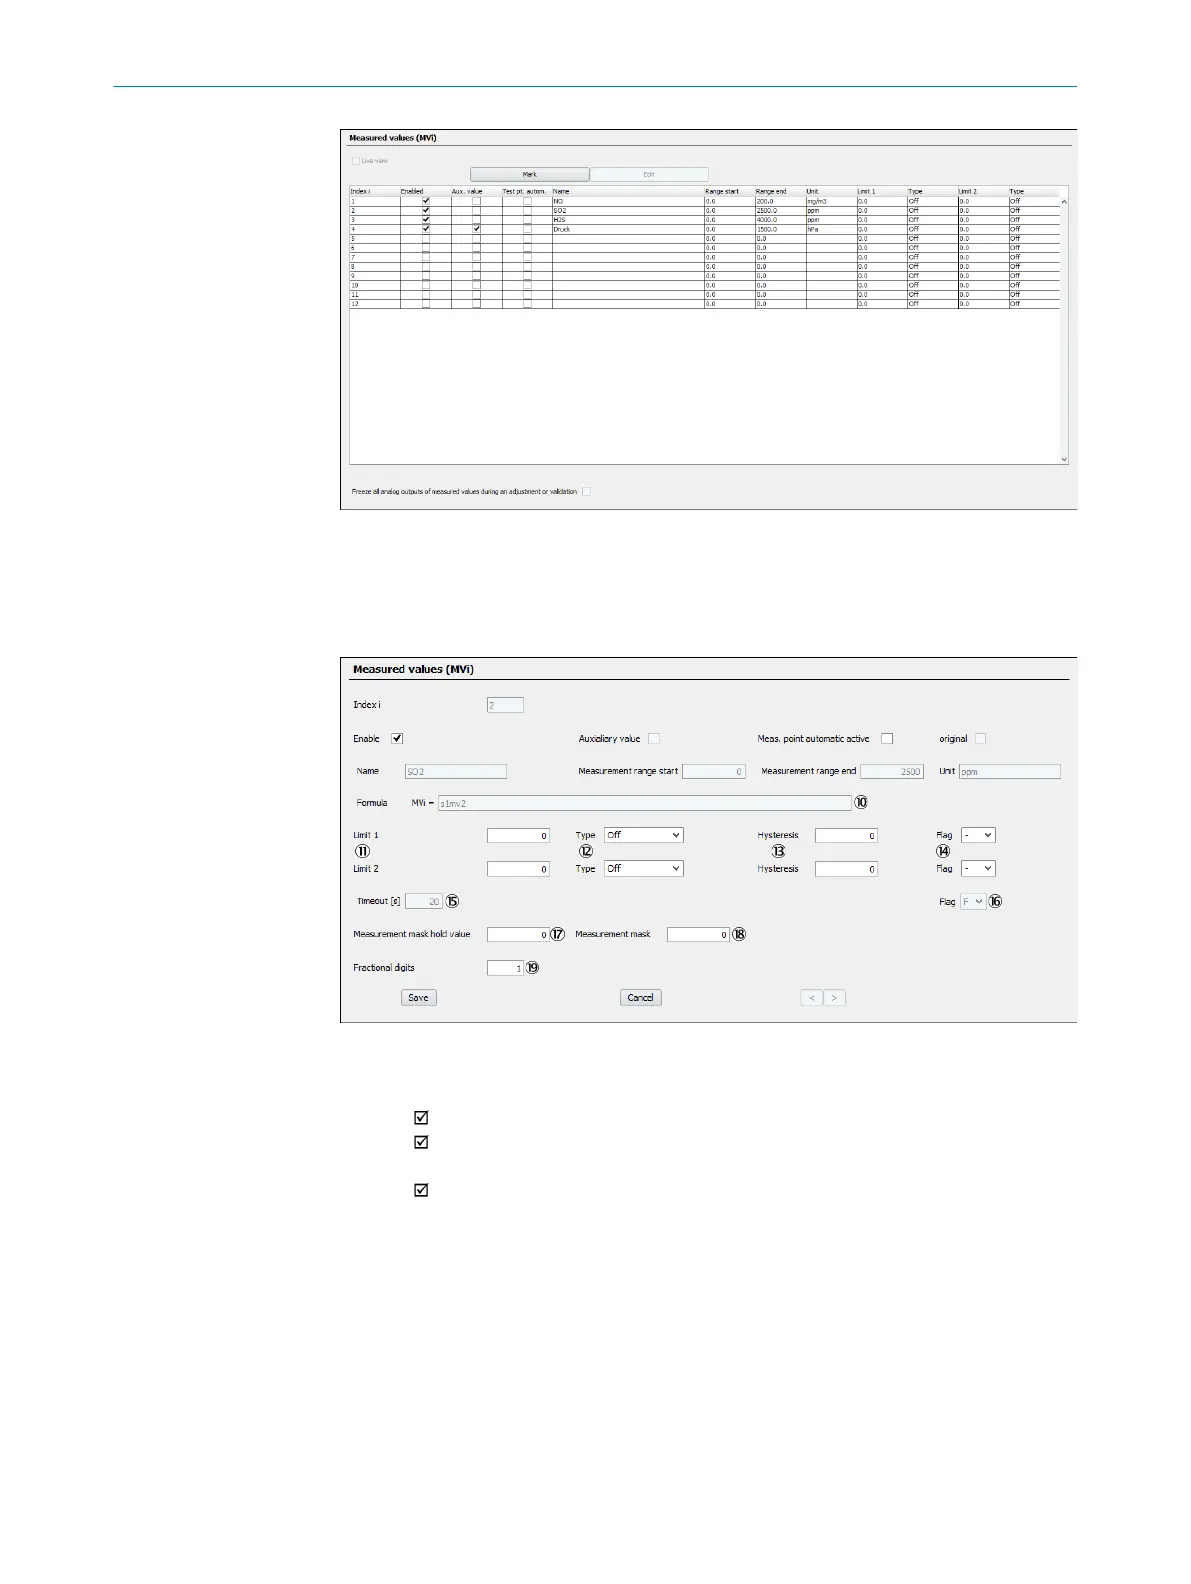
Figure 30: Menu “Measured values (MVi)” - Table (example)
2. Deactivate Live view.
3. Select the desired Table rows.
4. Select Edit.
Figure 31: Menu “Measured values (MVi)” - Edit (example)
1
Consecutive number (1 = MV1, 2 = MV2 etc.)
2
= the measured value is displayed and output
3
= the measured value is not shown on the display (all other usage options
remain available)
4
= an own “measured value” is created for each measuring point
5
Configuration of the measured value (MVi) relative to name, unit and mea‐
sured value fare as the source (sensor measured value)
6
Programmed name of the measured value
7
Start value of physical measuring range
8
End value of physical measuring range
9
Programmed physical unit for the measured value
ß
Formula for assignment or calculation of the measured value
à
Limit value
TESTS AND SETTINGS 6
8017324/15A2/V6-0/2019-10 | SICK T E C H N I C A L I N F O R M A T I O N | MARSIC200
51
Subject to change without notice
 Loading...