10 Virtual Touch Applications
10 - 22 Instructions for Use
Virtual Touch IQ Technique Hints
Virtual Touch IQ provides a two-dimensional display (map) of shear wave velocity or elasticity,
quality, travel time, and displacement information. Each of these maps represents a parameter
of the system-generated shear waves to assist in the interpretation of Virtual Touch IQ images.
Use the Quality map to confirm that shear wave formation was adequate and identify
regions of the shear wave image where shear wave velocity or elasticity estimations may
be artificially low due to poor shear wave signal quality. For example, in some exceptionally
stiff breast cancers, it can be difficult to adequately visualize and measure shear wave
velocities because of high tissue attenuation. Shear wave velocity or elasticity
measurements are reliable in locations of high signal quality and these locations are
represented in green; measurements are unreliable in locations of low signal quality and
these locations are represented in yellow/orange. When the shear wave quality is
orange/red, shear wave velocities cannot be estimated and the Velocity or Elasticity, Time,
and Displacement maps display only 2D-mode information.
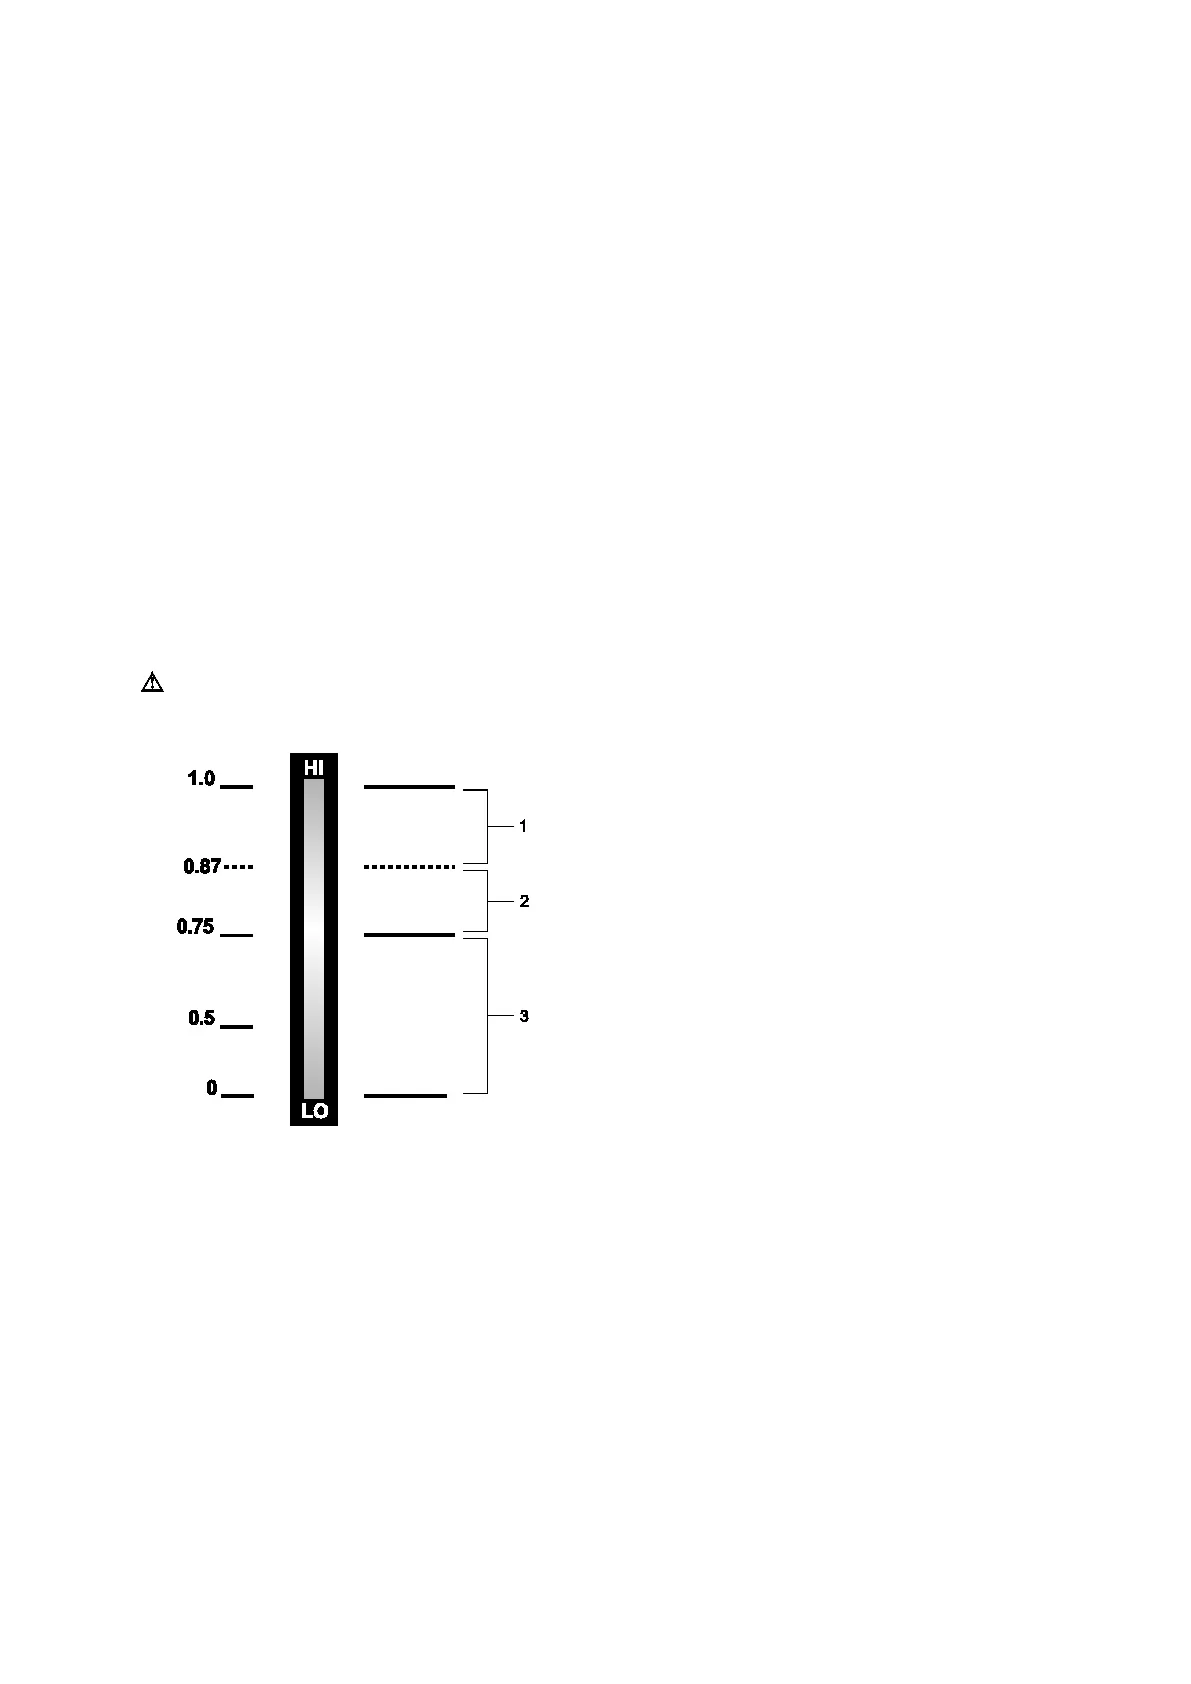
The following illustration depicts the use of color to represent shear wave quality. The color
indications in the Quality map help identify locations in the Velocity map where shear wave
velocity and elasticity estimations are reliable, may be unreliable, or could not be
estimated. The values in the left column indicate the quality index calculated by the system
software. Index values of 0 and 1.0 represent the minimum and maximum quality. A
threshold of 0.75 is used to determine that estimates of shear wave velocity or elasticity
are not possible. When the quality index is below 0.75, the system displays only 2D-mode
information.
Caution: In lesions where multiple or extensive areas of low shear wave quality are
encountered, shear wave velocity or elasticity estimates in the lesion should be interpreted with
caution.
Example of the color bar for the Quality map.
1 Reliable shear wave velocity or elasticity estimate (green to yellow-green)
2 Shear wave velocity or elasticity estimate may be unreliable (yellow-green to yellow-orange)
3 Shear wave velocity or elasticity estimate not possible (yellow-orange to red)
 Loading...