Appendix E Advanced Feature Controls
E - 36 Instructions for Use
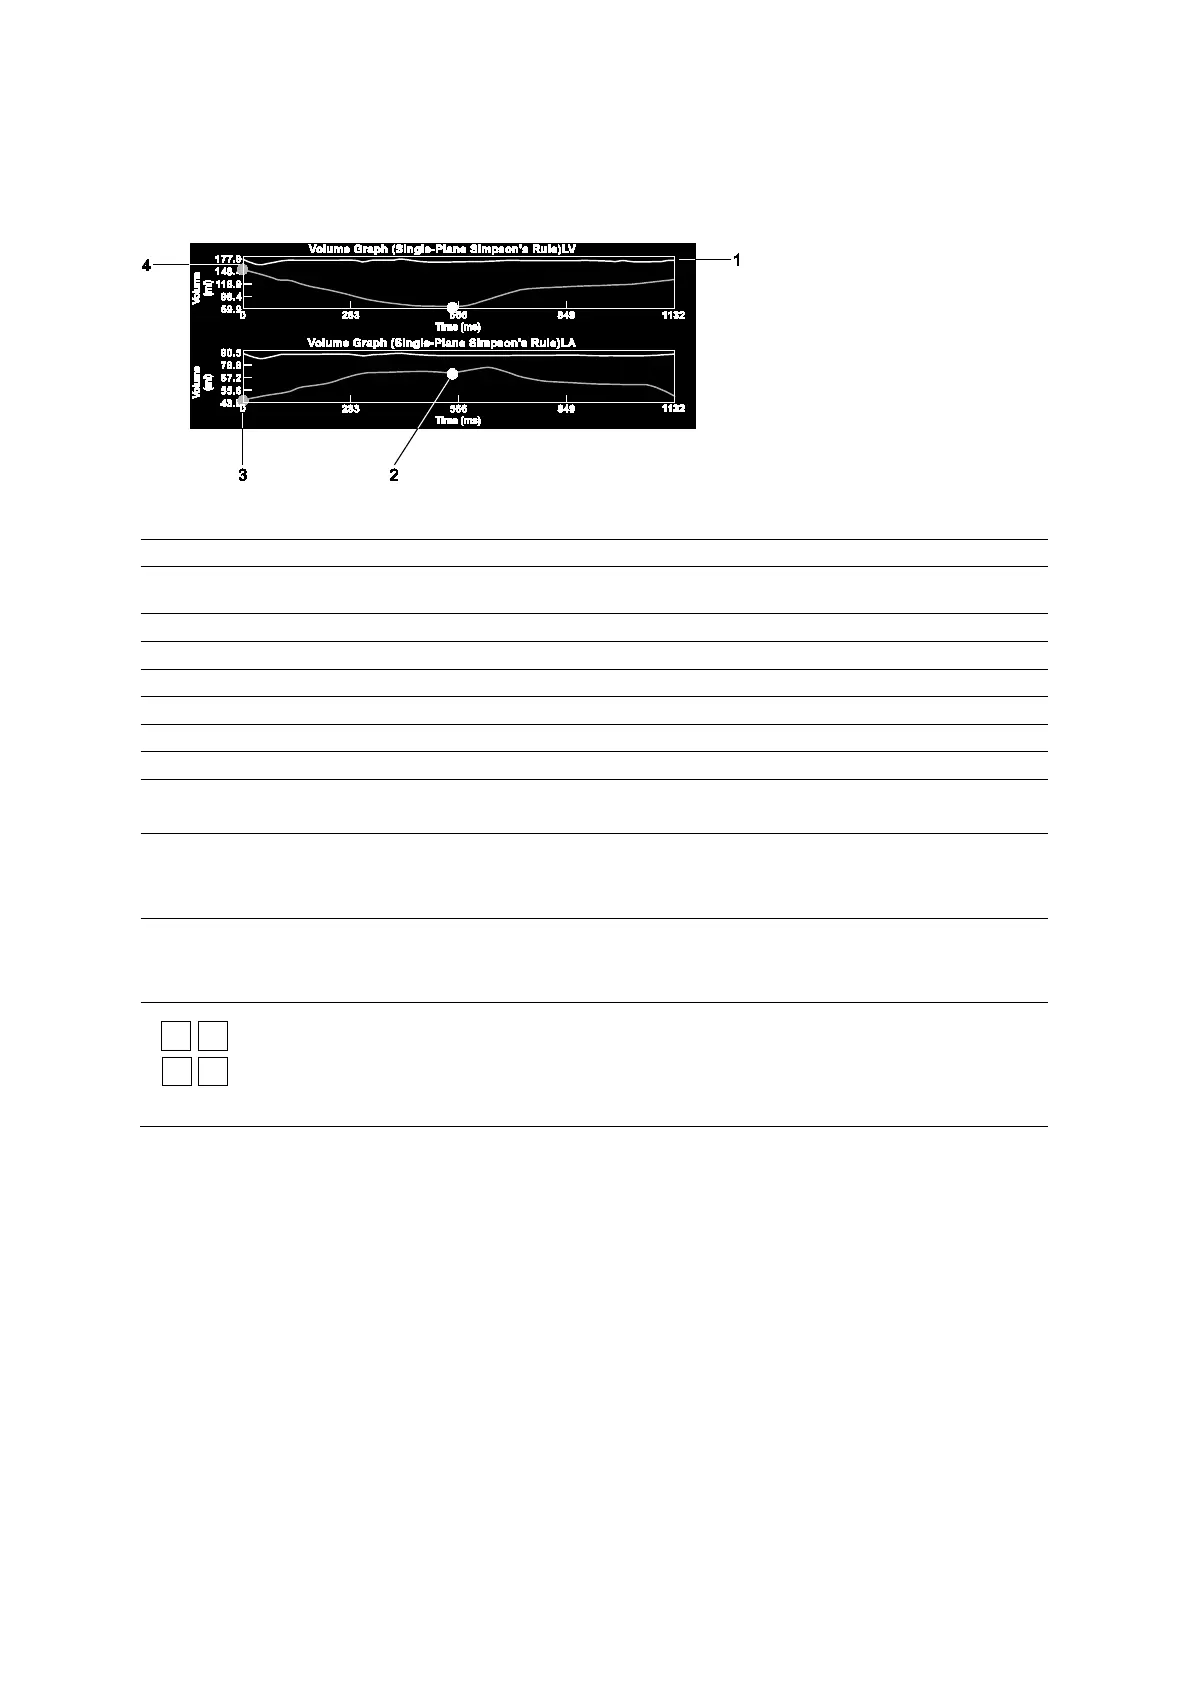
Example of Volume Graph
For non-contrast studies, the program displays a volume graph. The volume graph depicts the
values for volume (ml or ml/m
2
) over time (ms), using a Single-Plane Simpson's Rule.
1 ECG trace
2 Inactive ED or ES frame
(indicated by gray dot)
3 Current frame (indicated by
vertical line)
4 Active ED or ES frame
(indicated by green dot)
When both the left ventricle and the left atrium are assessed, syngo Auto Left Heart displays
two volume graphs, one for each chamber.
Flip Left/Right
Reorients the image view selection from left-to-right to right-to-left to match the orientation
of the clip.
Selects the left ventricle as the active chamber.
Selects the left atrium as the active chamber.
A4C Selects the apical four-chamber image view (non-contrast) for the displayed clip.
A2C Selects the apical two-chamber image view (non-contrast) for the displayed clip.
Selects the contrast apical four-chamber image view for the displayed clip.
Selects the contrast apical two-chamber image view for the displayed clip.
F8 function key or
GAIN FREEZE/CINE
(Available only for systems without a touch screen)
Starts or stops playback of the clip in the active view (
or
).
Left or right arrow key Displays prior or next frame of the clip.
Note: For systems without a touch screen, the selection is assigned to the
GAIN FREEZE/CINE control.
Stop Stops playback of the clip.
Note: For systems without a touch screen, the selection is assigned to the
GAIN FREEZE/CINE control.
Indicates the selected heart cycle from multiple-cycle clips.
 Loading...