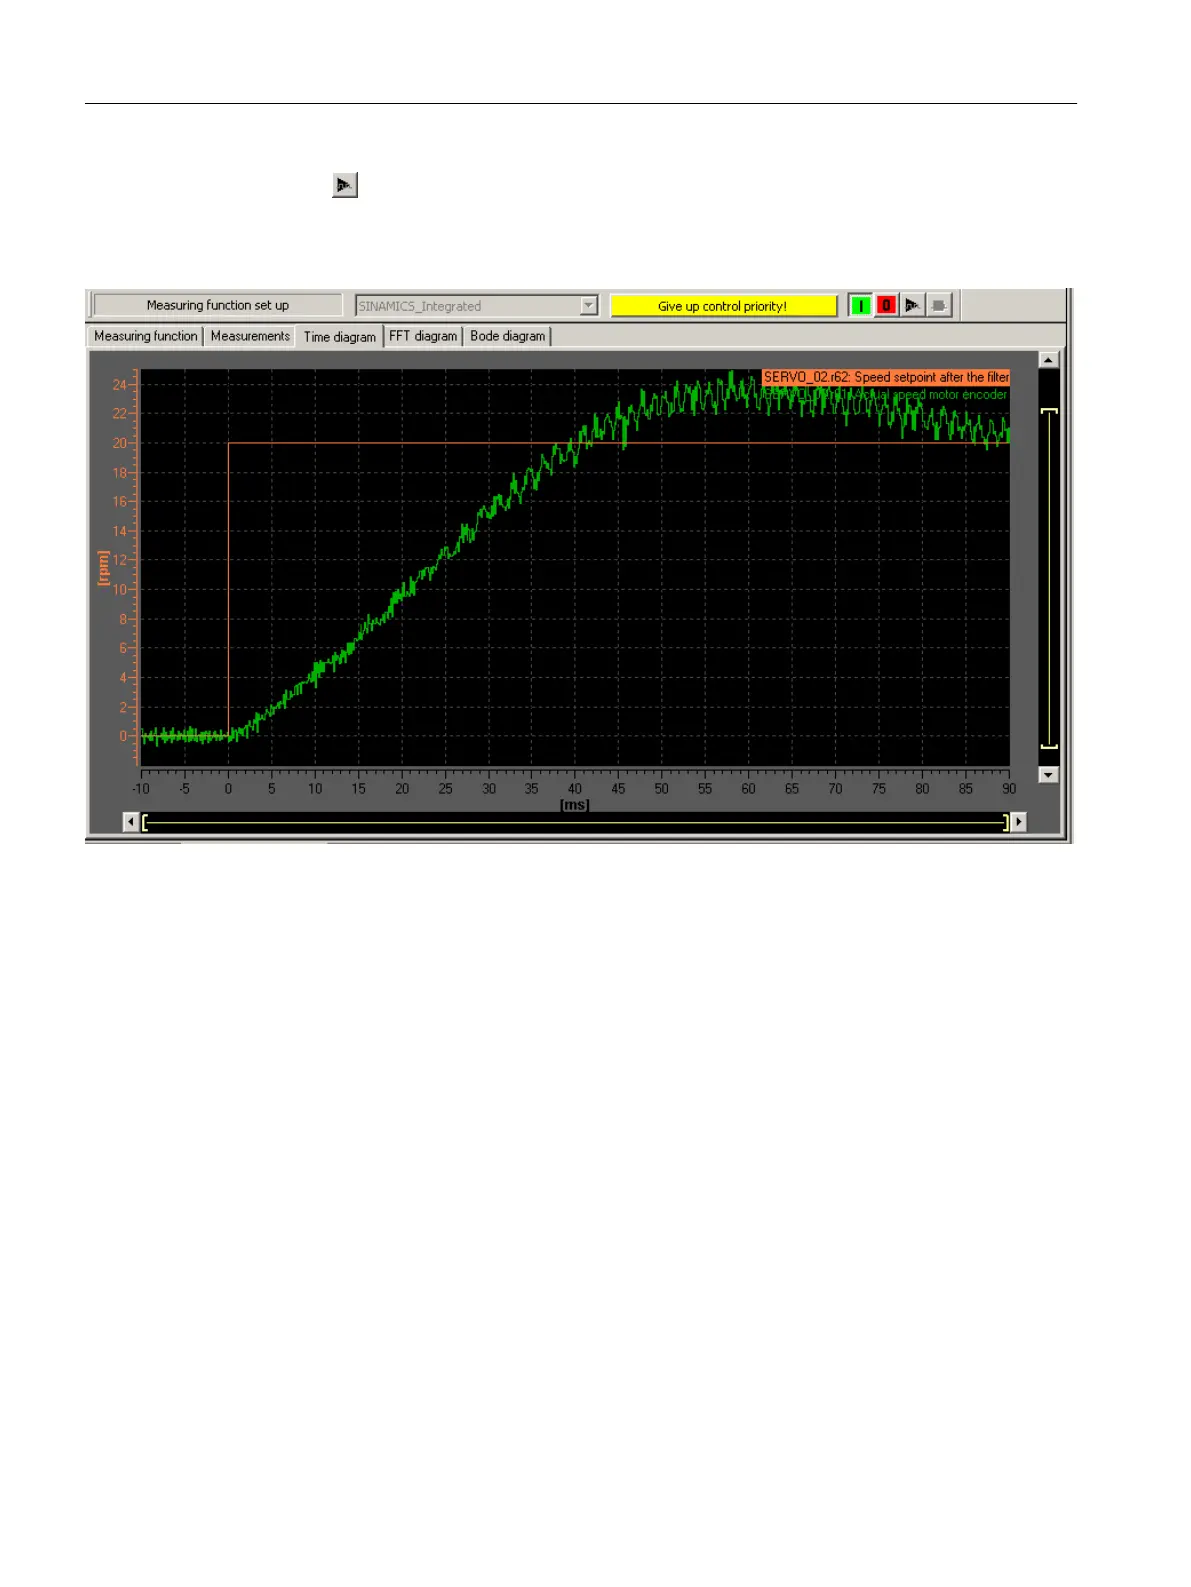
3. Click (Start measuring function) to start the measuring function.
The
axis is moved during the measurement. For this reason, a safety message that allows
the process to be aborted is displayed.
4. The traced signals are represented on the "Time diagram" tab.
Figure 7-40 Time diagram before parameter change
Commissioning (software)
7.14 Optimizing the drive and controller
SIMOTION D410-2
228 Commissioning and Hardware Installation Manual, 01/2015
 Loading...