7 Interpreting Measured I-V Curves
7-3
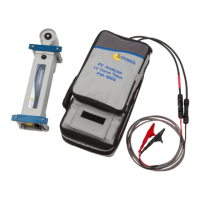
Figure 57. Definition of the Fill Factor.
Fill Factor does not very much with irradiance so long as the irradiance is high, which
means that comparing Fill Factor values is a good way to assess the consistency of I-V
curve shapes in variable (but high) irradiance situations.
The Shape of a Normal I-V Curve
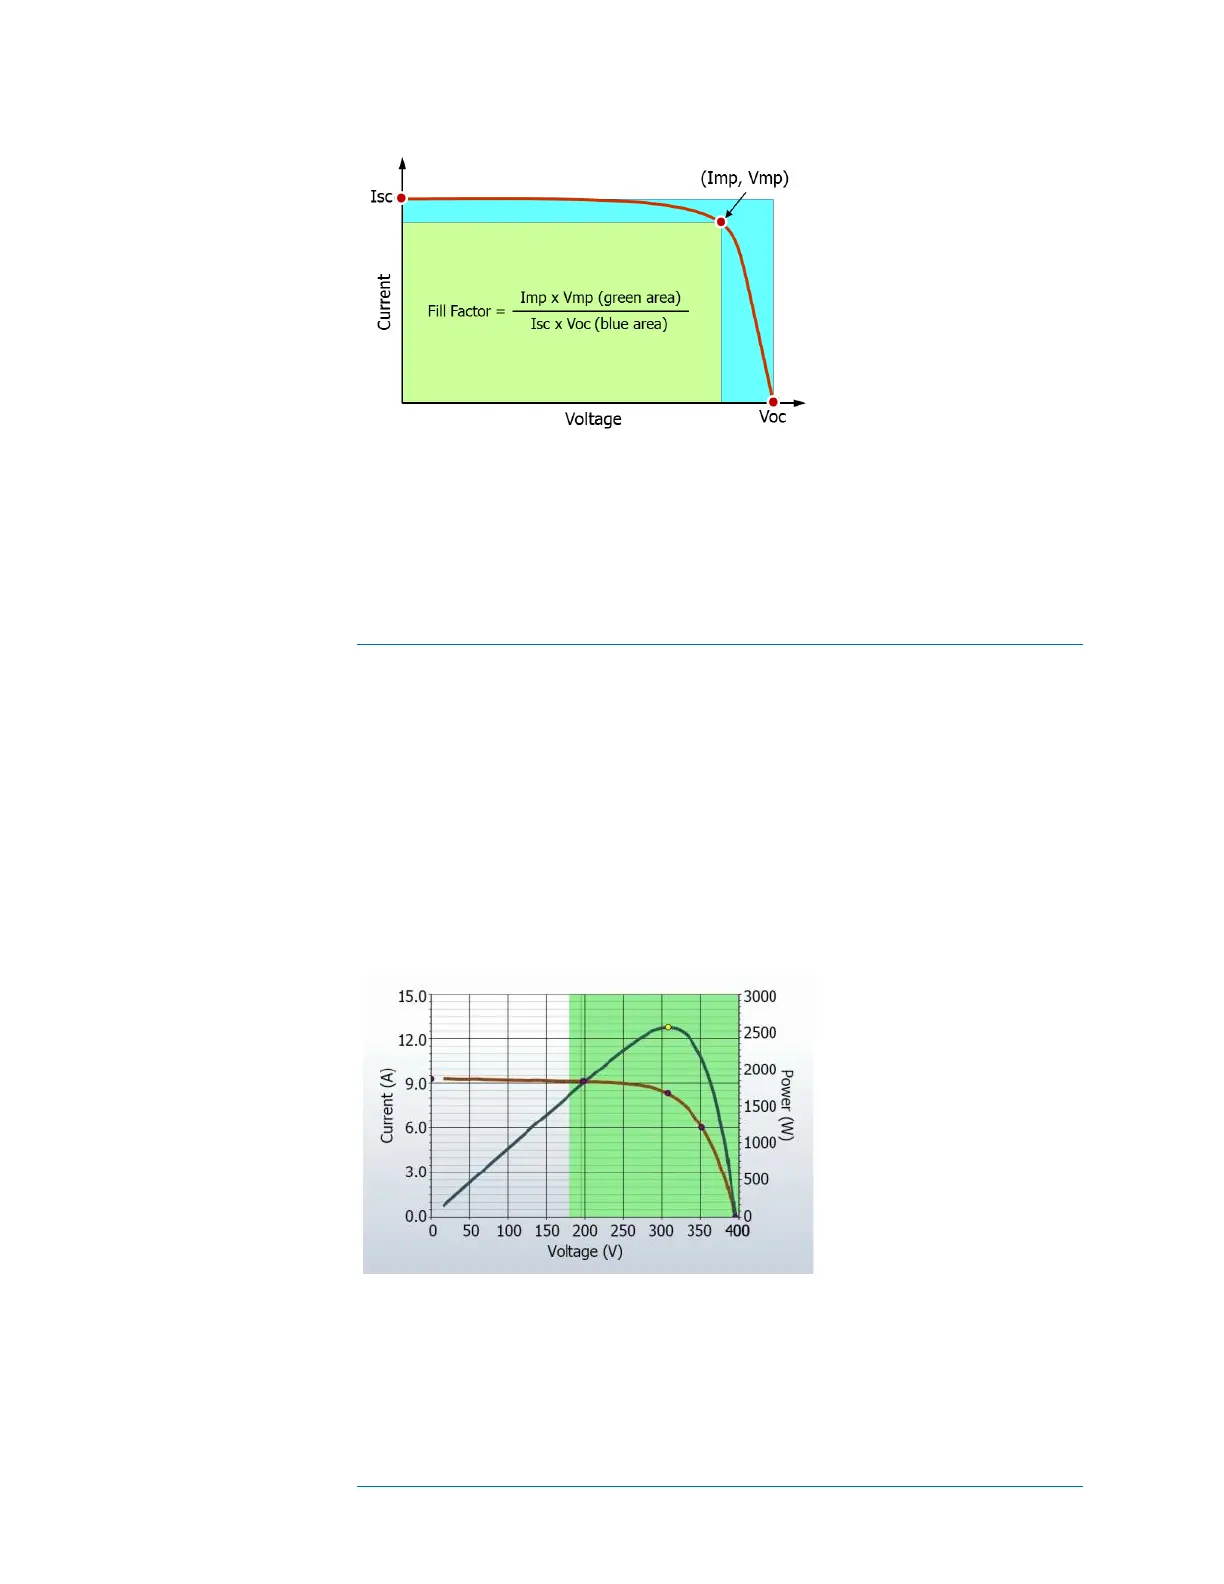
Figure 58 below shows a normal I-V curve (red line), as a starting point for the
discussion. The predicted I-V curve shape, determined by the PVA built-in PV model, is
shown by the three dots. The power versus voltage curve is also displayed (blue line).
Like the I-V curve itself, the P-V curve represents the entire family of points at which the
PV circuit could be operated or loaded. The P-V curve is generated by multiplying I x V
for at every point on the I-V curve.
Figure 58. A normal I-V curve for the parallel combination of two strings of eight
175-watt modules, showing conformance with five points predicted by the PV
model.

 Loading...