3 Software Overview
3-21
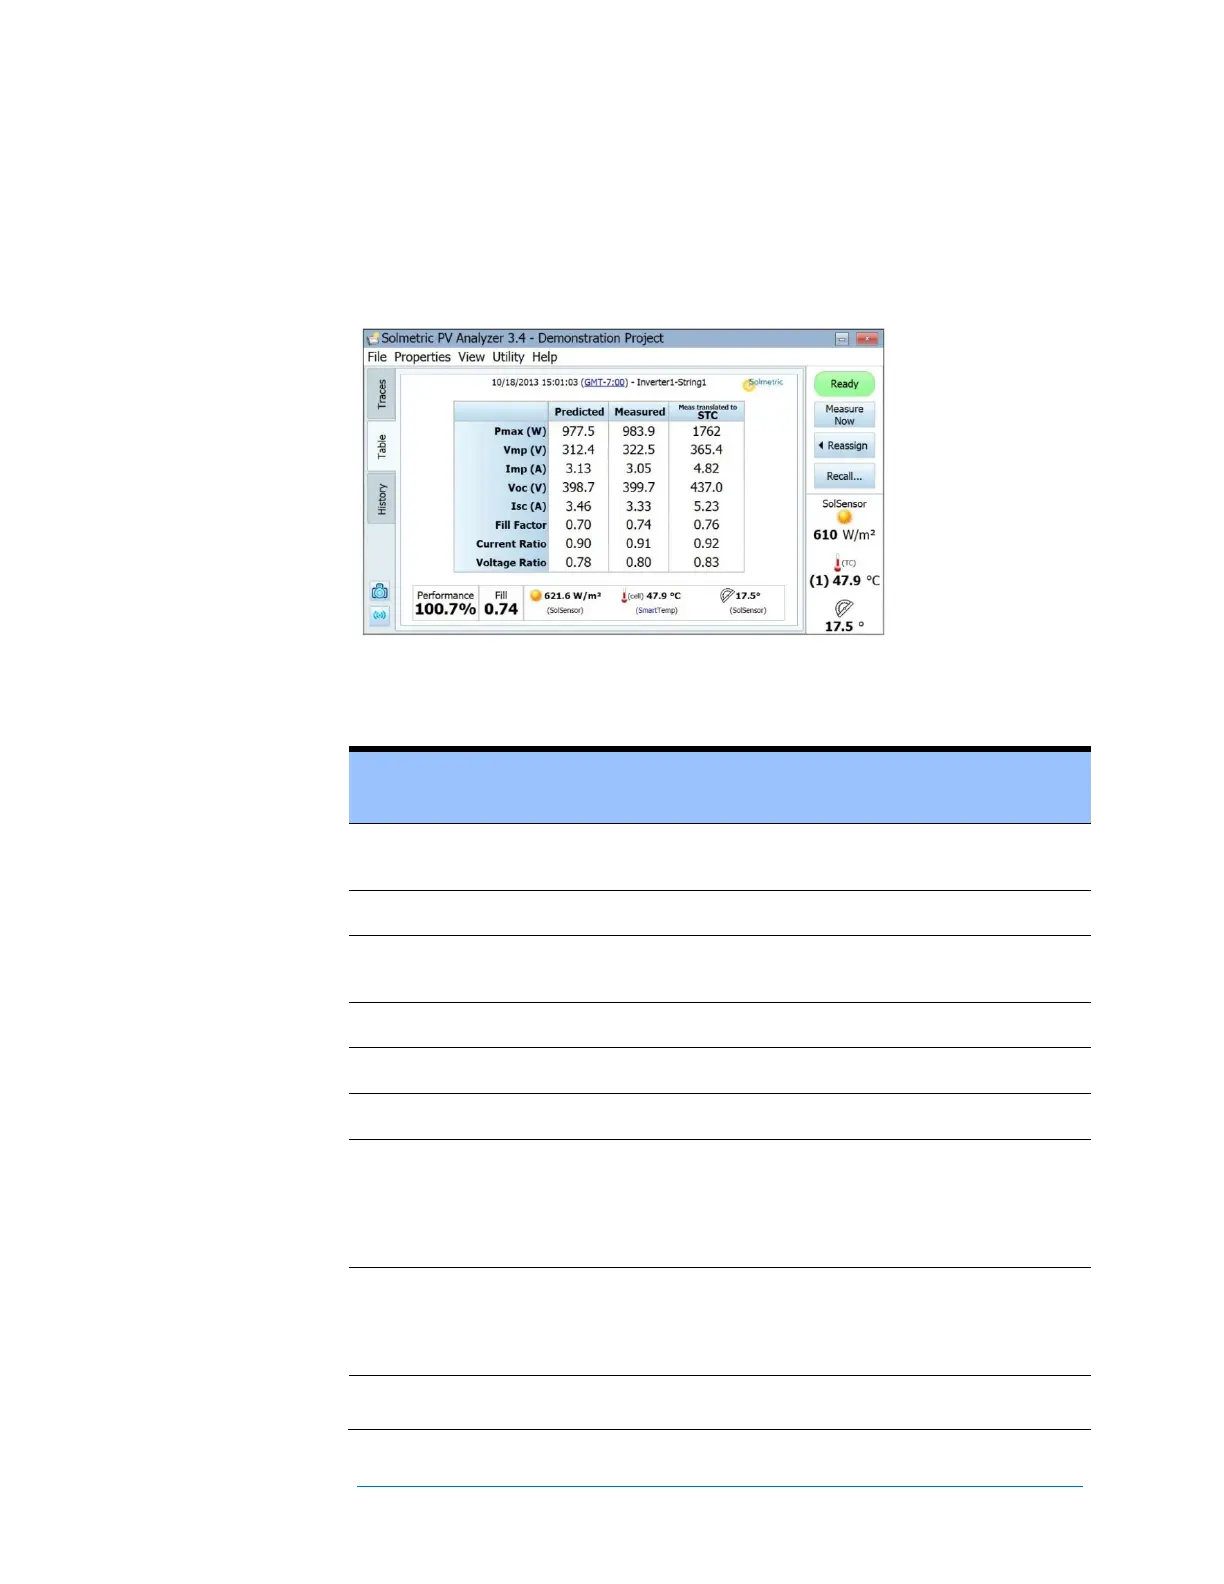
Table Tab
Presents summaries of the predicted and measured I-V data and a translation of the
measurement results to Standard Test Conditions. Figure 47 is an example of the Table
tab screen. This section describes the table itself. See the Traces Tab section for
explanations of other controls and displays on this screen.
Figure 47. Table tab
Table 14. Table tab description
Displays the predicted values from the selected performance
model.
Displays actual measured values most recently measured.
Displays a translation of the measured parameters to
Standard Test Conditions, 1000W/m2 and 25 C.
Measured maximum power values in Watts.
Voltage at the maximum power point.
Current at the maximum power point.
Open circuit voltage. The Voc measurement is performed by
a high impedance voltmeter circuit immediately before the
actual I-V sweep. This Voc value is accurate even if the
measured I-V curve does not extend all the way down to the
horizontal axis.
Short circuit current. The first point of the I-V sweep is slightly
to the right of the vertical axis of the I-V curve graph. The
PVA software draws a horizontal line from this point back to
the vertical axis.
The Fill Factor (FF) is an indication of the squareness of the I-
V curve (a more square 'knee' of the curve indicates greater
 Loading...