201/317
7 - Debugger and PROM Programmer Tutorial for ST72251
The top line is where we are now. The next line is where we came from. If we click on this
second line, and select the View/Source option, the window showing the
Main.asm source-
pops up and line 45 is highlighted in blue. This is very convenient, especially in C language as
we shall see later.
7.3.3.7 Watching the execution trace
An emulator is used to watch a program executing, see which branches it takes, and the
values it reads and produces. The stepping method described above seems okay; but actu-
ally, it might not always be usable. The main two reasons for this are:
The piece of program to run is too long to be traced in a reasonable amount of time;
This particular piece of program deals with real events that cannot be slowed down, and the
program must run at full speed to correctly handle them.
The answer to this problem is the real-time trace.
Let us start the program at full speed, then either stop it by hand or let it stop at a breakpoint.
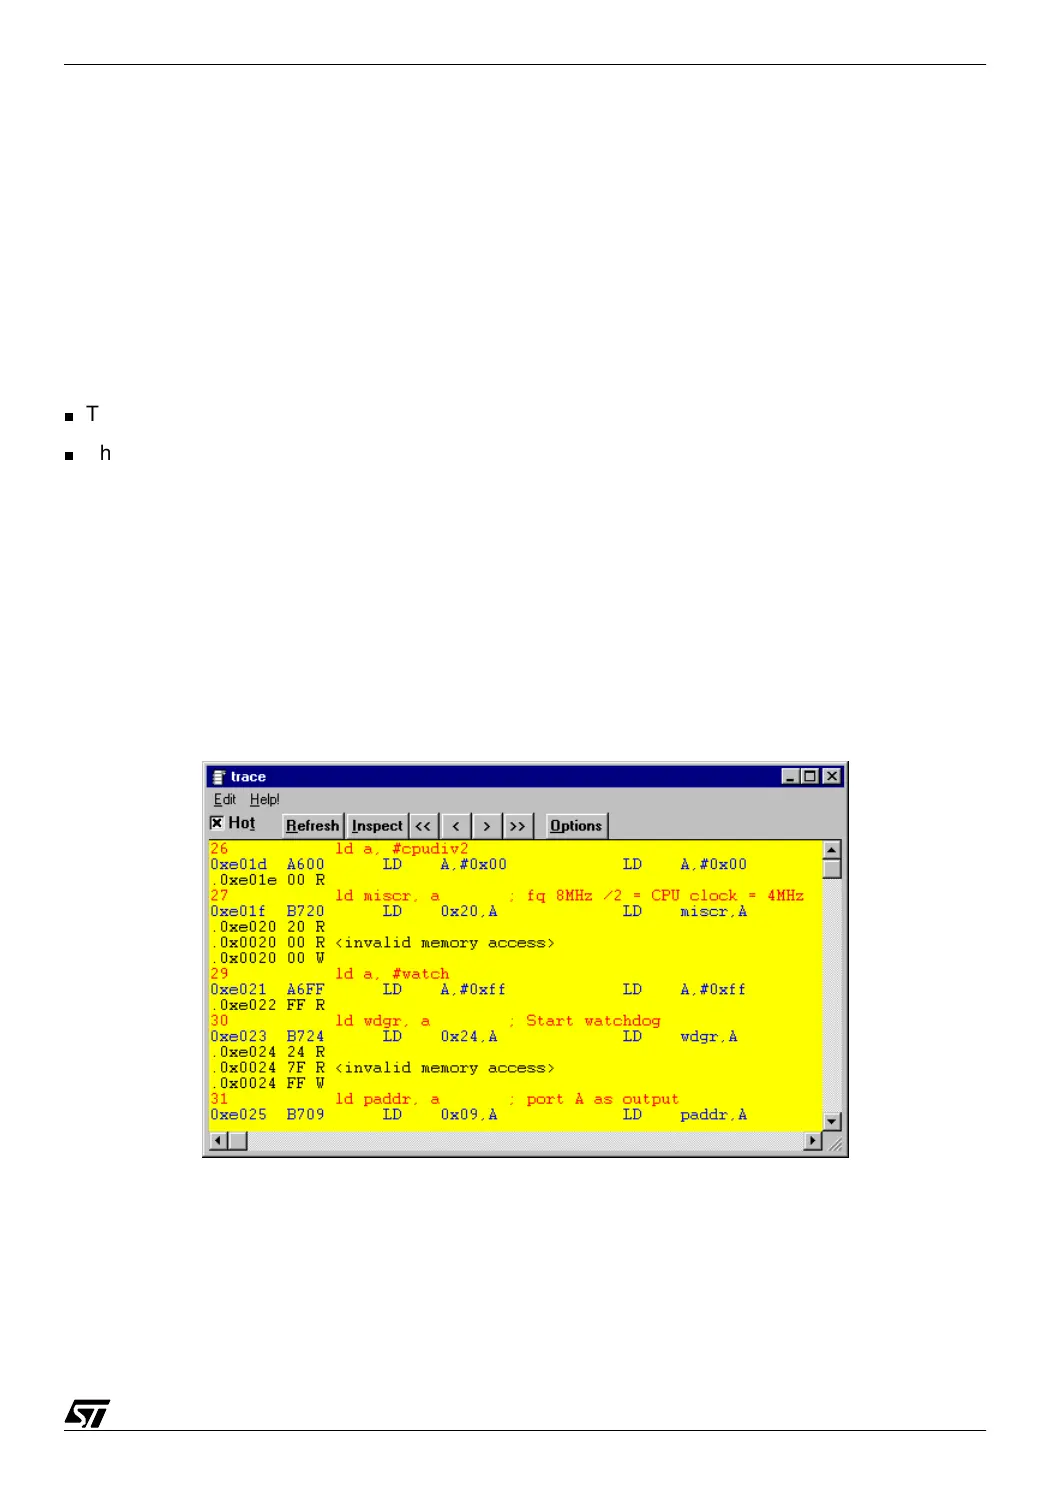
Now, choosing the Windows/Trace option, we can see a new window opening. It looks like the
following:
07-emu14.bmp
The display is made of lines that are successively red, blue and black.