52
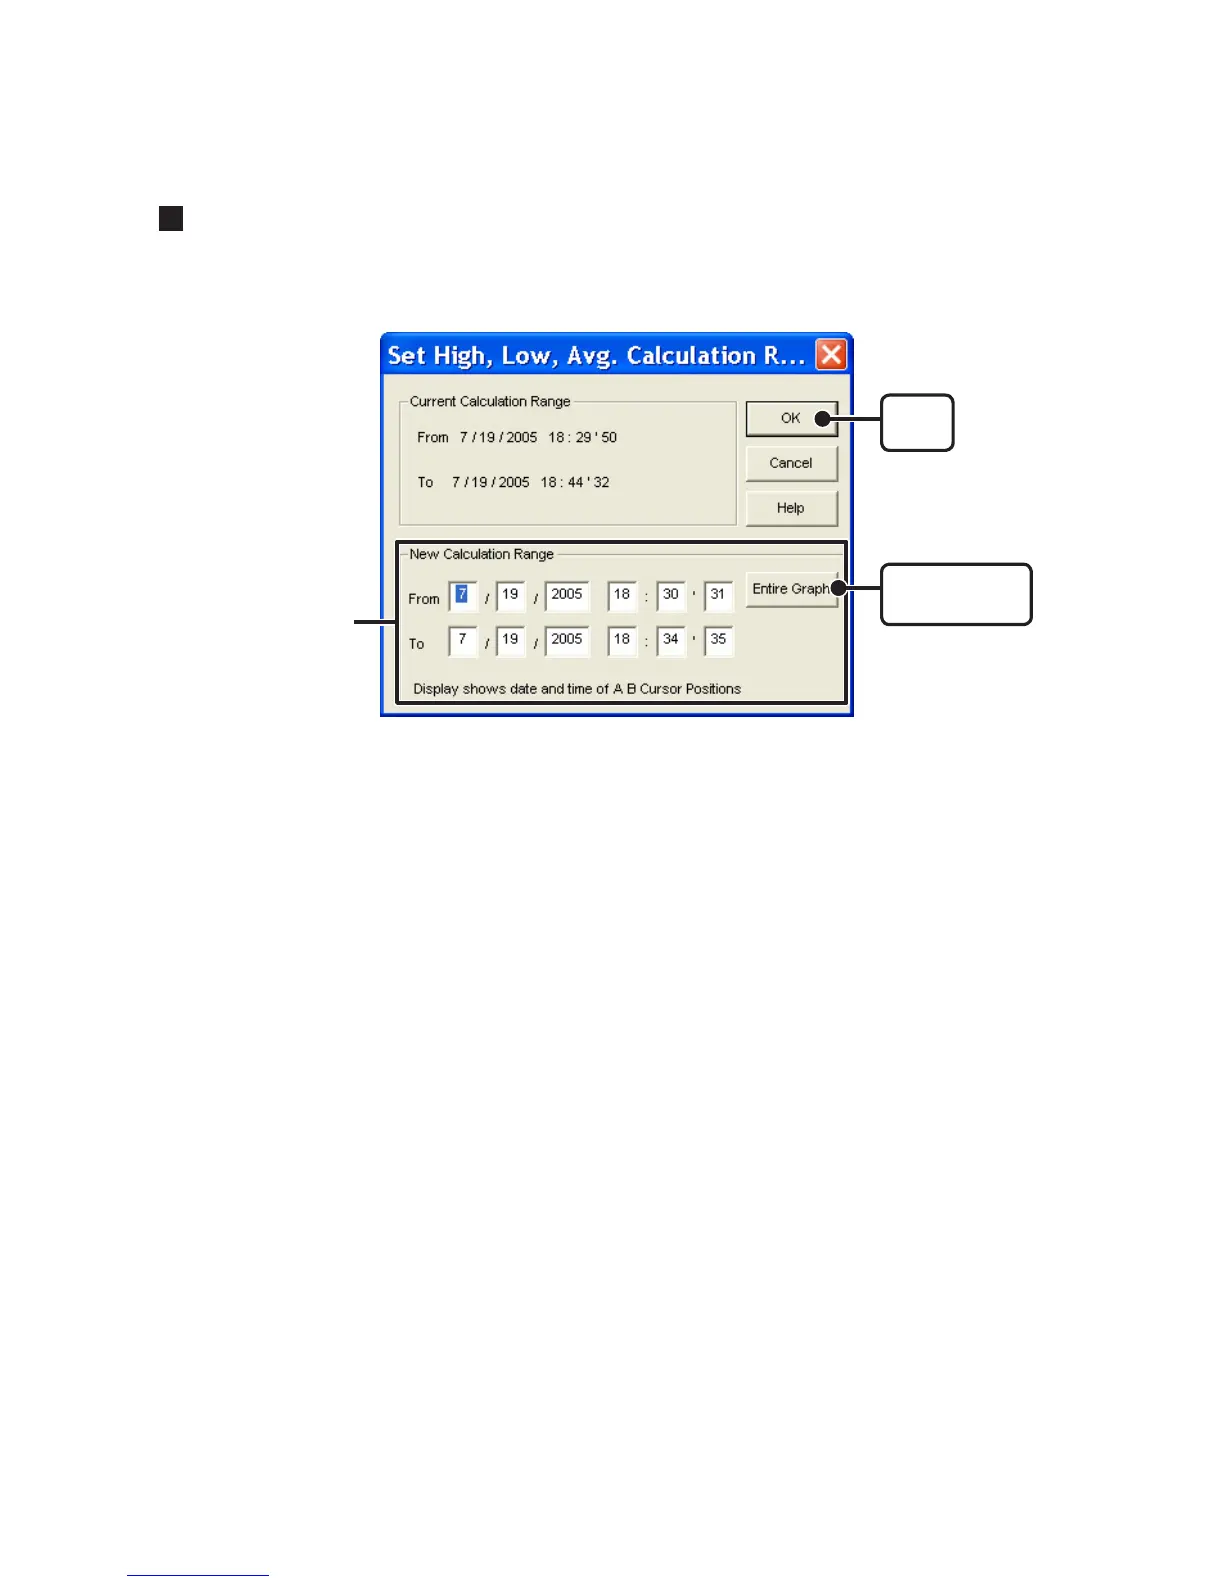
Setting the Max. Min. Avg Calculation Range : [Tools] Menu
1. Set the calculation range in the [Set High, Low, Avg. Calculation].
[OK]
button
[Entire Graph]
button
Enter the numerical
values
- By clicking the [Entire Graph] button, the dates and times for the entire graph will be
displayed.
- If in the graph display, place the A cursor at the position for the beginning of the calculation
range and the B cursor at the end of the range, and those dates and times will appear as the
new range in the [Set High, Low, Average Calculation Range] Display when it is opened.
2. Click the [OK] button to finish.