EasyManuals Logo

Texas Instruments TI-84 PLUS - Graphing Calculator User Manual

Texas Instruments TI-84 PLUS - Graphing Calculator
422 pages
To Next Page IconTo Next Page
To Previous Page IconTo Previous Page
Page #127 background imageLoading...
Page #127 background image
Chapter 7: Tables 120
Displaying Other Dependent Variables
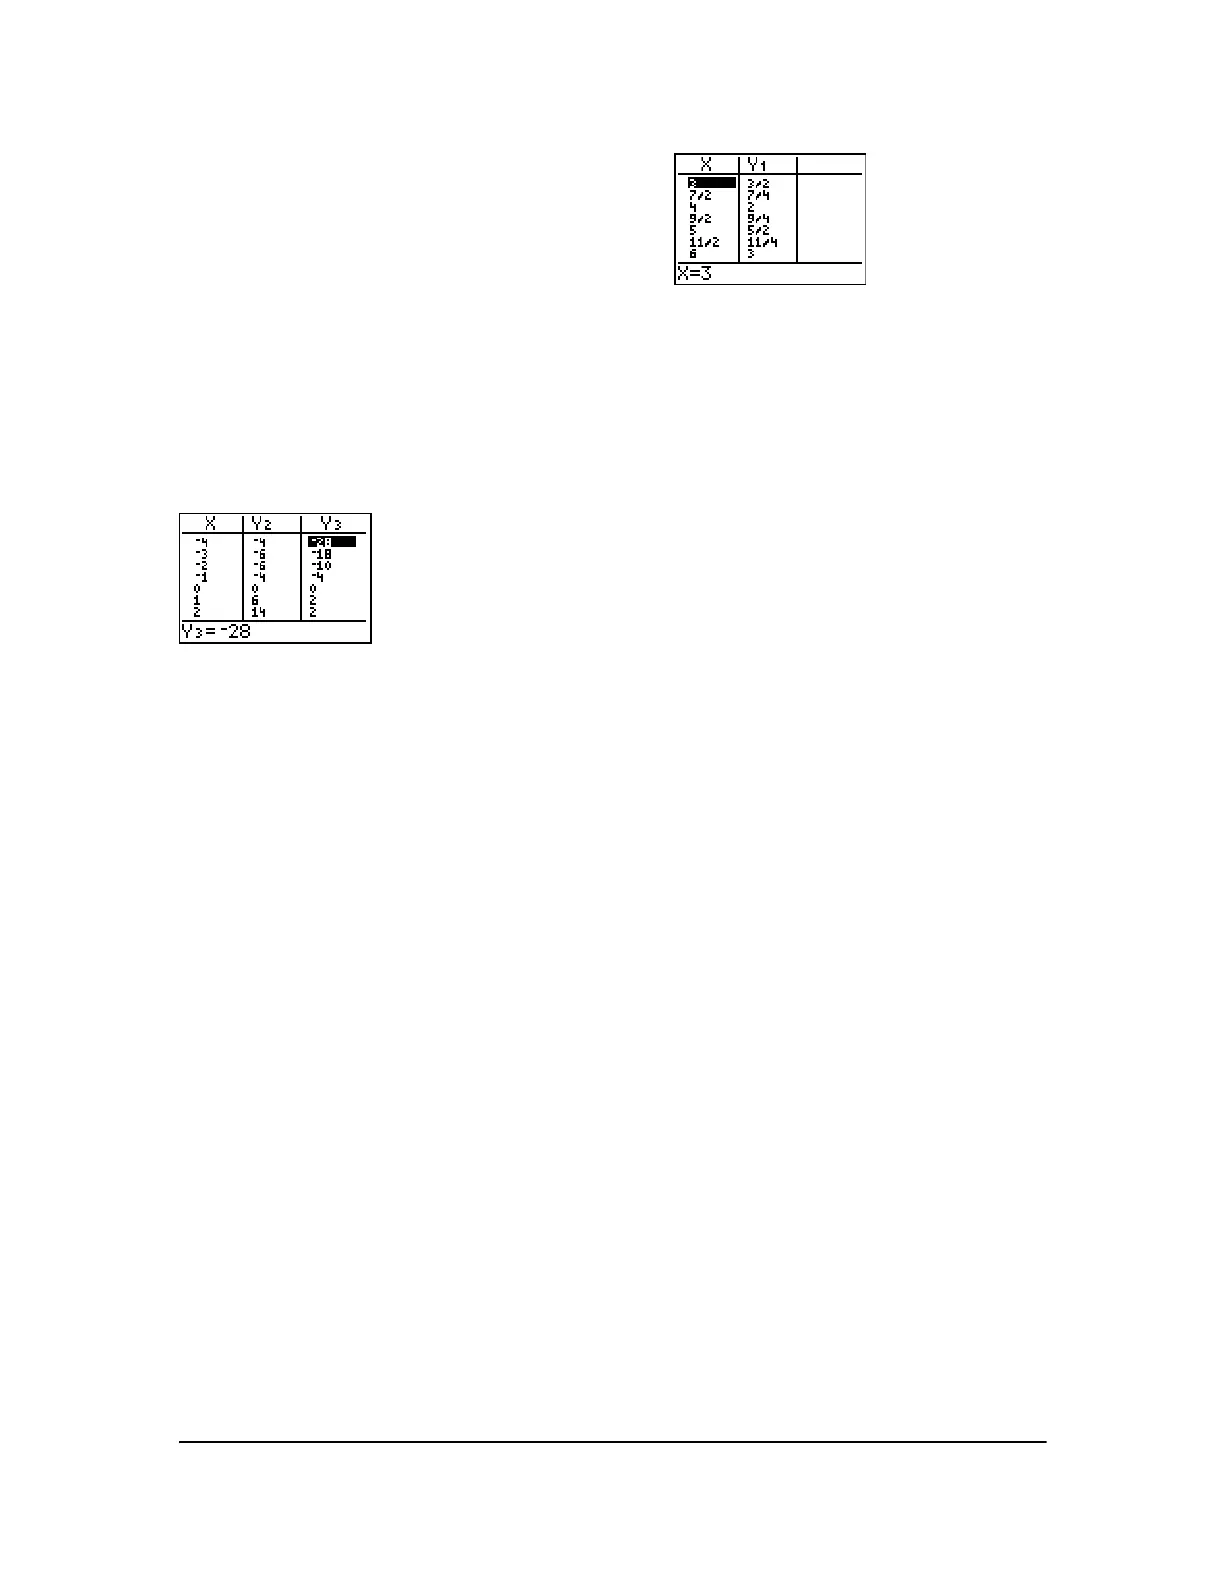
If you have defined more than two dependent variables, the first two selected Y= functions are
displayed initially. Press ~ or | to display dependent variables defined by other selected Y=
functions. The independent variable always remains in the left column, except during a trace with
parametric graphing mode and G-T split-screen mode set.
Note: To simultaneously display two dependent variables on the table that are not defined as
consecutive Y= functions, go to the Y= editor and deselect the Y= functions between the two you
want to display. For example, to simultaneously display Y4 and Y7 on the table, go to the Y= editor
and deselect Y5 and Y6.
5. Press Í.

Table of Contents

Questions and Answers:

Question and Answer IconNeed help?

Do you have a question about the Texas Instruments TI-84 PLUS - Graphing Calculator and is the answer not in the manual?

Texas Instruments TI-84 PLUS - Graphing Calculator Specifications

General IconGeneral
TypeGraphing Calculator
Display TypeLCD
Screen Resolution96 x 64 pixels
ProcessorZilog Z80
Memory24 KB RAM, 480 KB Flash ROM
Power Source4 AAA batteries (with backup lithium battery)
ConnectivityI/O port
Weight7.4 oz (210 g)
SoftwareTI-OS (Texas Instruments Operating System)

Related product manuals