Chapter 12: Statistics 181
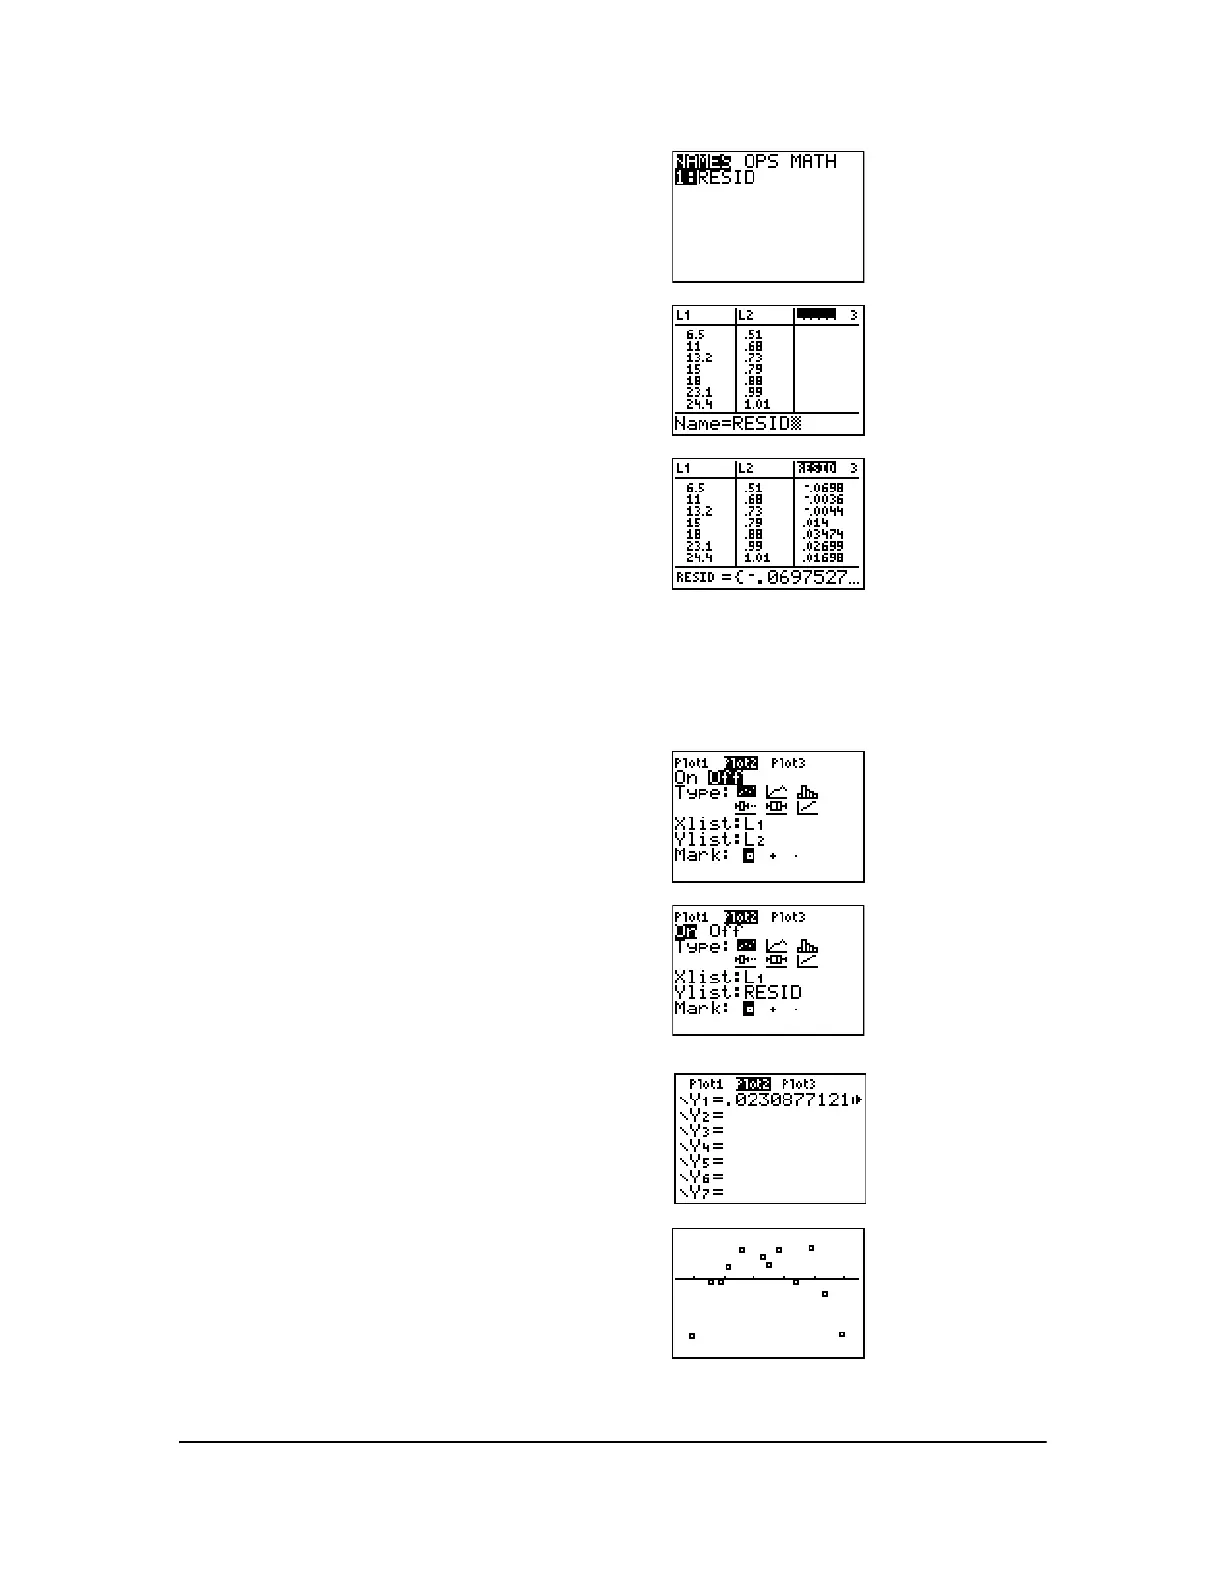
Notice that the first three residuals are negative. They correspond to the shortest pendulum string
lengths in
L1. The next five residuals are positive, and three of the last four are negative. The latter
correspond to the longer string lengths in
L1. Plotting the residuals will show this pattern more
clearly.
16. Press y 9 to display the
LIST NAMES menu.
If necessary, press † to move the cursor onto the
list name
RESID.
17. Press Í to select
RESID and paste it to the
stat list editor’s
Name= prompt.
18. Press Í.
RESID is stored in column 3 of the
stat list editor.
Press † repeatedly to examine the residuals.
19. Press y ,
2 to select 2:Plot2 from the
STAT PLOTS menu. The stat plot editor is
displayed for plot 2.
20. Press Í to select
On, which turns on plot 2.
Press † Í to select " (scatter plot). Press
† y d to specify
Xlist:L1 for plot 2. Press † ãRä
ãEä ãSä ãIä ãDä (alpha-lock is on) to specify
Ylist:RESID for plot 2. Press † Í to select ›
as the mark for each data point on the scatter plot.
21. Press o to display the Y= editor.
Press | to move the cursor onto the
= sign, and
then press Í to deselect
Y1. Press } Í to
turn off plot 1.
22. Press q
9 to select 9:ZoomStat from the ZOOM
menu. The window variables are adjusted
automatically, and plot 2 is displayed. This is a
scatter plot of the residuals.
 Loading...


