Chapter 12: Statistics 210
When three are plotted, the first one plots at the top, the second in the middle, and the third at the
bottom.
NormProbPlot
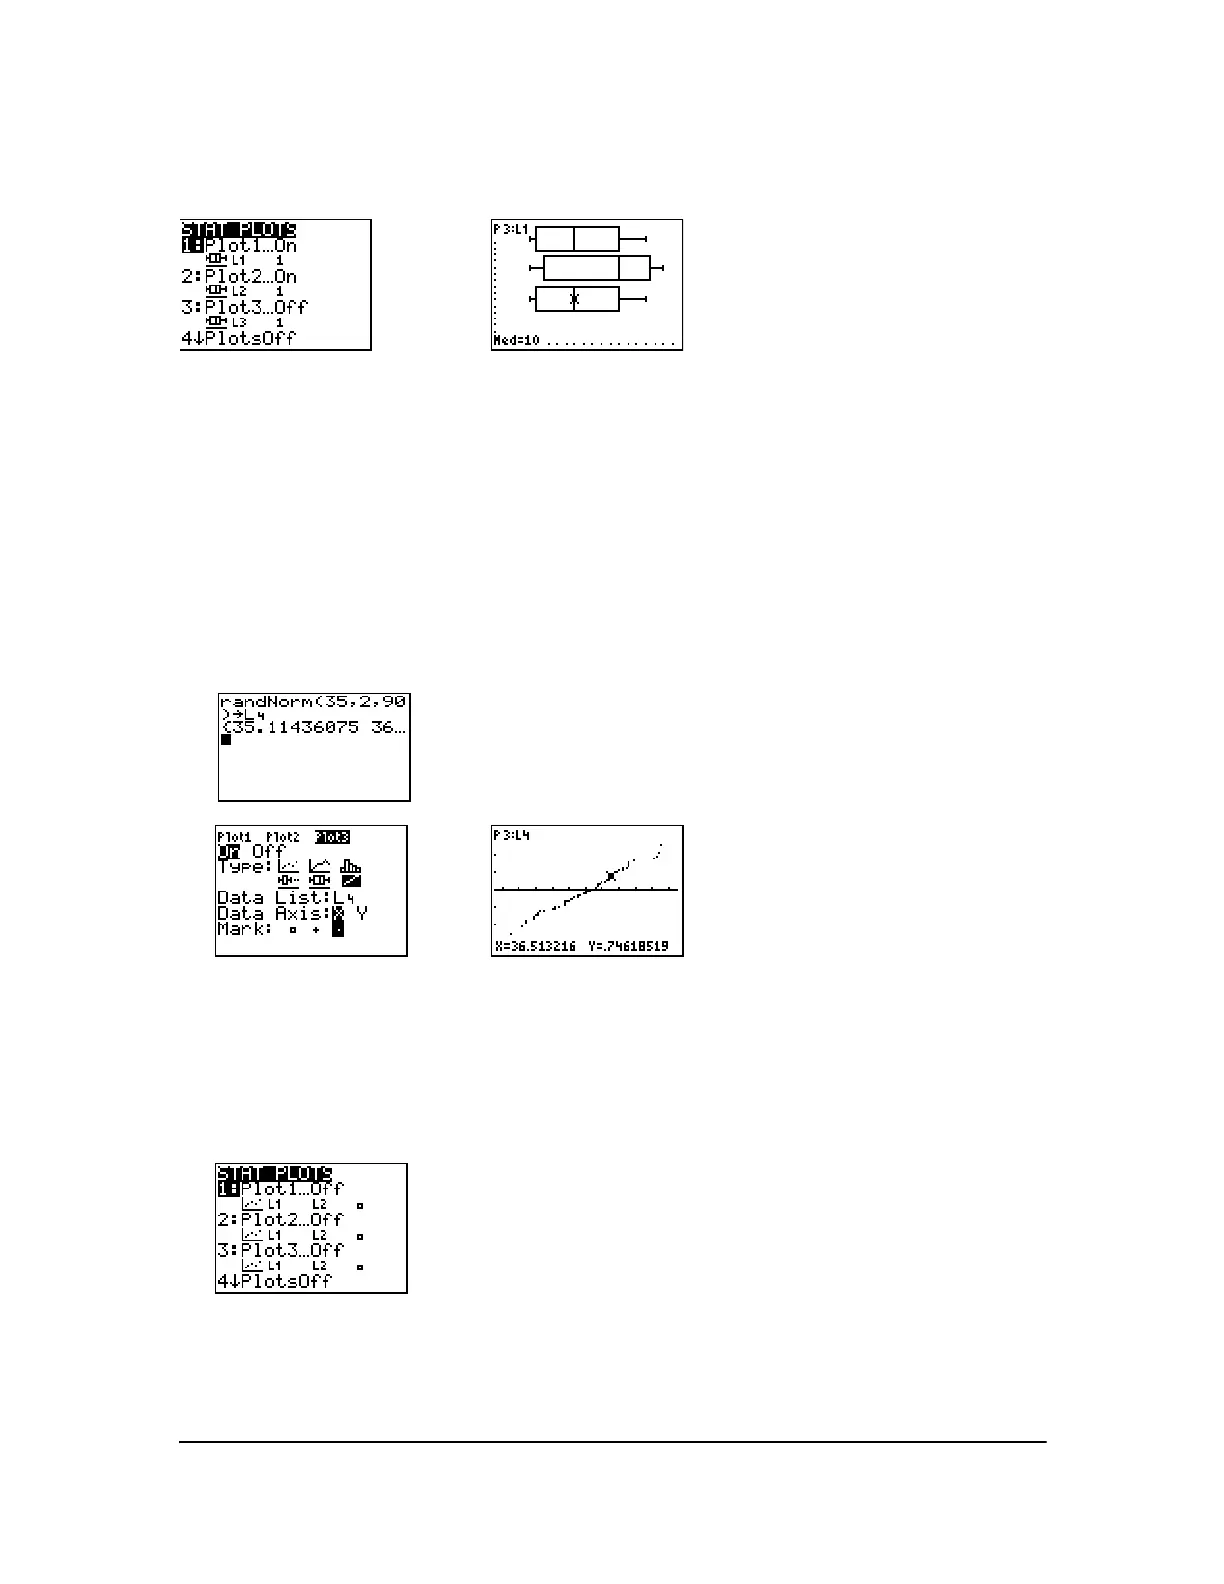
NormProbPlot (Ô) (normal probability plot) plots each observation X in Data List versus the
corresponding quantile z of the standard normal distribution. If the plotted points lie close to a
straight line, then the plot indicates that the data are normal.
Enter a valid list name in the
Data List field. Select X or Y for the Data Axis setting.
• If you select X, the TI-84 Plus plots the data on the x-axis and the z-values on the y-axis.
• If you select Y, the TI-84 Plus plots the data on the y-axis and the z-values on the x-axis.
Defining the Plots
To define a plot, follow these steps.
1. Press y ,. The STAT PLOTS menu is displayed with the current plot definitions.
2. Select the plot you want to use. The stat plot editor is displayed for the plot you selected.

 Loading...


