Chapter 12: Statistics 211
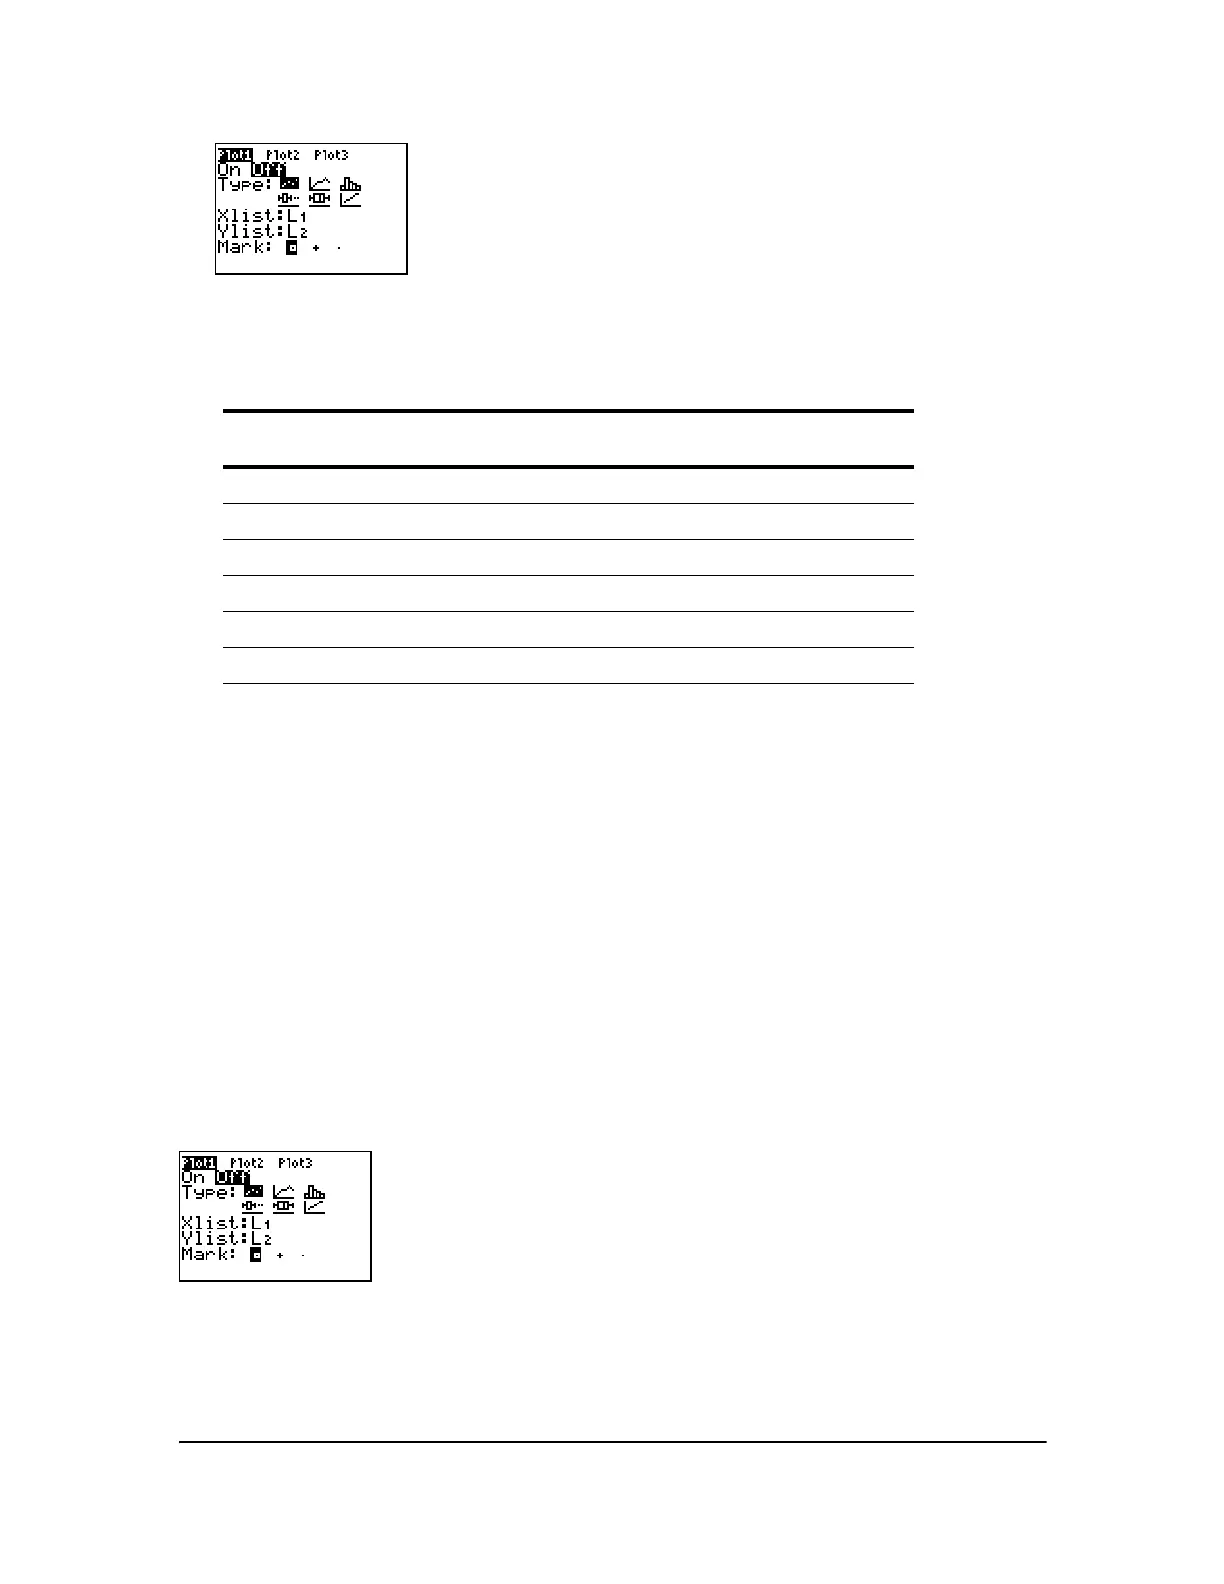
3. Press Í to select On if you want to plot the statistical data immediately. The definition is
stored whether you select
On or Off.
4. Select the type of plot. Each type prompts for the options checked in this table.
Plot Type XList YList Mark Freq
Data
List
Data
Axis
" Scatter _ _ _ œ œ œ
Ó xyLine _ _ _ œ œ œ
Ò Histogram _ œ œ _ œ œ
Õ ModBoxplot _ œ _ _ œ œ
Ö Boxplot _ œ œ _ œ œ
Ô NormProbPlot œ œ _ œ _ _
5. Enter list names or select options for the plot type.
• Xlist (list name containing independent data)
• Ylist (list name containing dependent data)
• Mark (› or + or ¦)
• Freq (frequency list for Xlist elements; default is 1)
• Data List (list name for NormProbPlot)
• Data Axis (axis on which to plot Data List)
Displaying Other Stat Plot Editors
Each stat plot has a unique stat plot editor. The name of the current stat plot (
Plot1, Plot2, or Plot3)
is highlighted in the top line of the stat plot editor. To display the stat plot editor for a different plot,
press } and ~ to move the cursor onto the name in the top line, and then press Í. The stat
plot editor for the selected plot is displayed, and the selected name remains highlighted.

 Loading...


