Chapter 13: Inferential Statistics and Distributions 249
Note: Before you execute a DISTR DRAW instruction, you must set the window variables so that the
desired distribution fits the screen.
DISTR DRAW
1: ShadeNorm(
Shades normal distribution.
2: Shade_t(
Shades Student-t distribution.
3:
Shadec
2
(
Shades c
2
distribution.
4: ShadeÜ( Shades Üdistribution.
Note: L1â99 and 1â99 specify infinity. If you want to view the area left of upperbound, for example,
specify
lowerbound=L1â99.
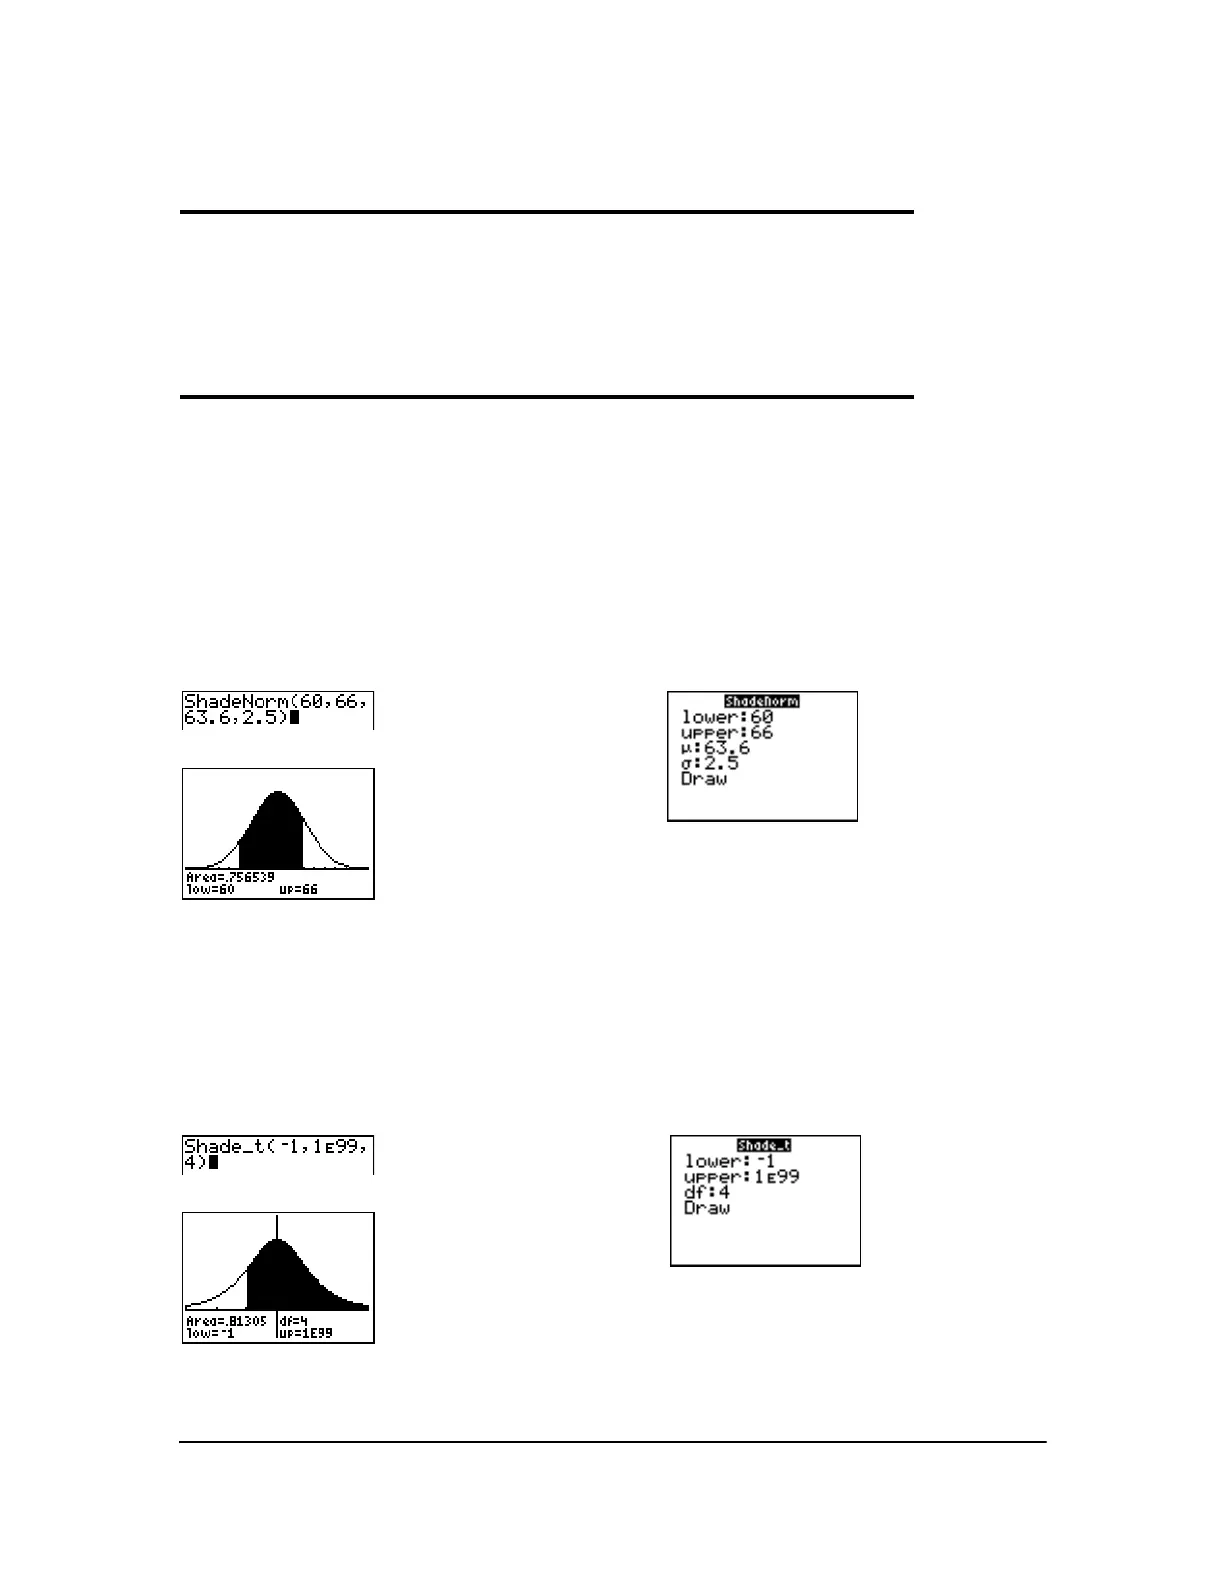
ShadeNorm(
ShadeNorm( draws the normal density function specified by mean m and standard deviation s and
shades the area between
lowerbound and upperbound. The defaults are m=0 and s=1.
ShadeNorm(lowerbound,upperbound[,m,s])
Classic
Note: For this example,
Xmin = 55
Xmax = 72
Ymin = L.05
Ymax = .2
Shade_t(
Shade_t( draws the density function for the Student-t distribution specified by df (degrees of
freedom) and shades the area between
lowerbound and upperbound.
Shade_t(lowerbound,upperbound,df)
Classic
Note: For this example,
Xmin = L3
Xmax = 3
Ymin = L.15
Ymax = .5
 Loading...


