Chapter 13: Inferential Statistics and Distributions 250
Shadec
2
(
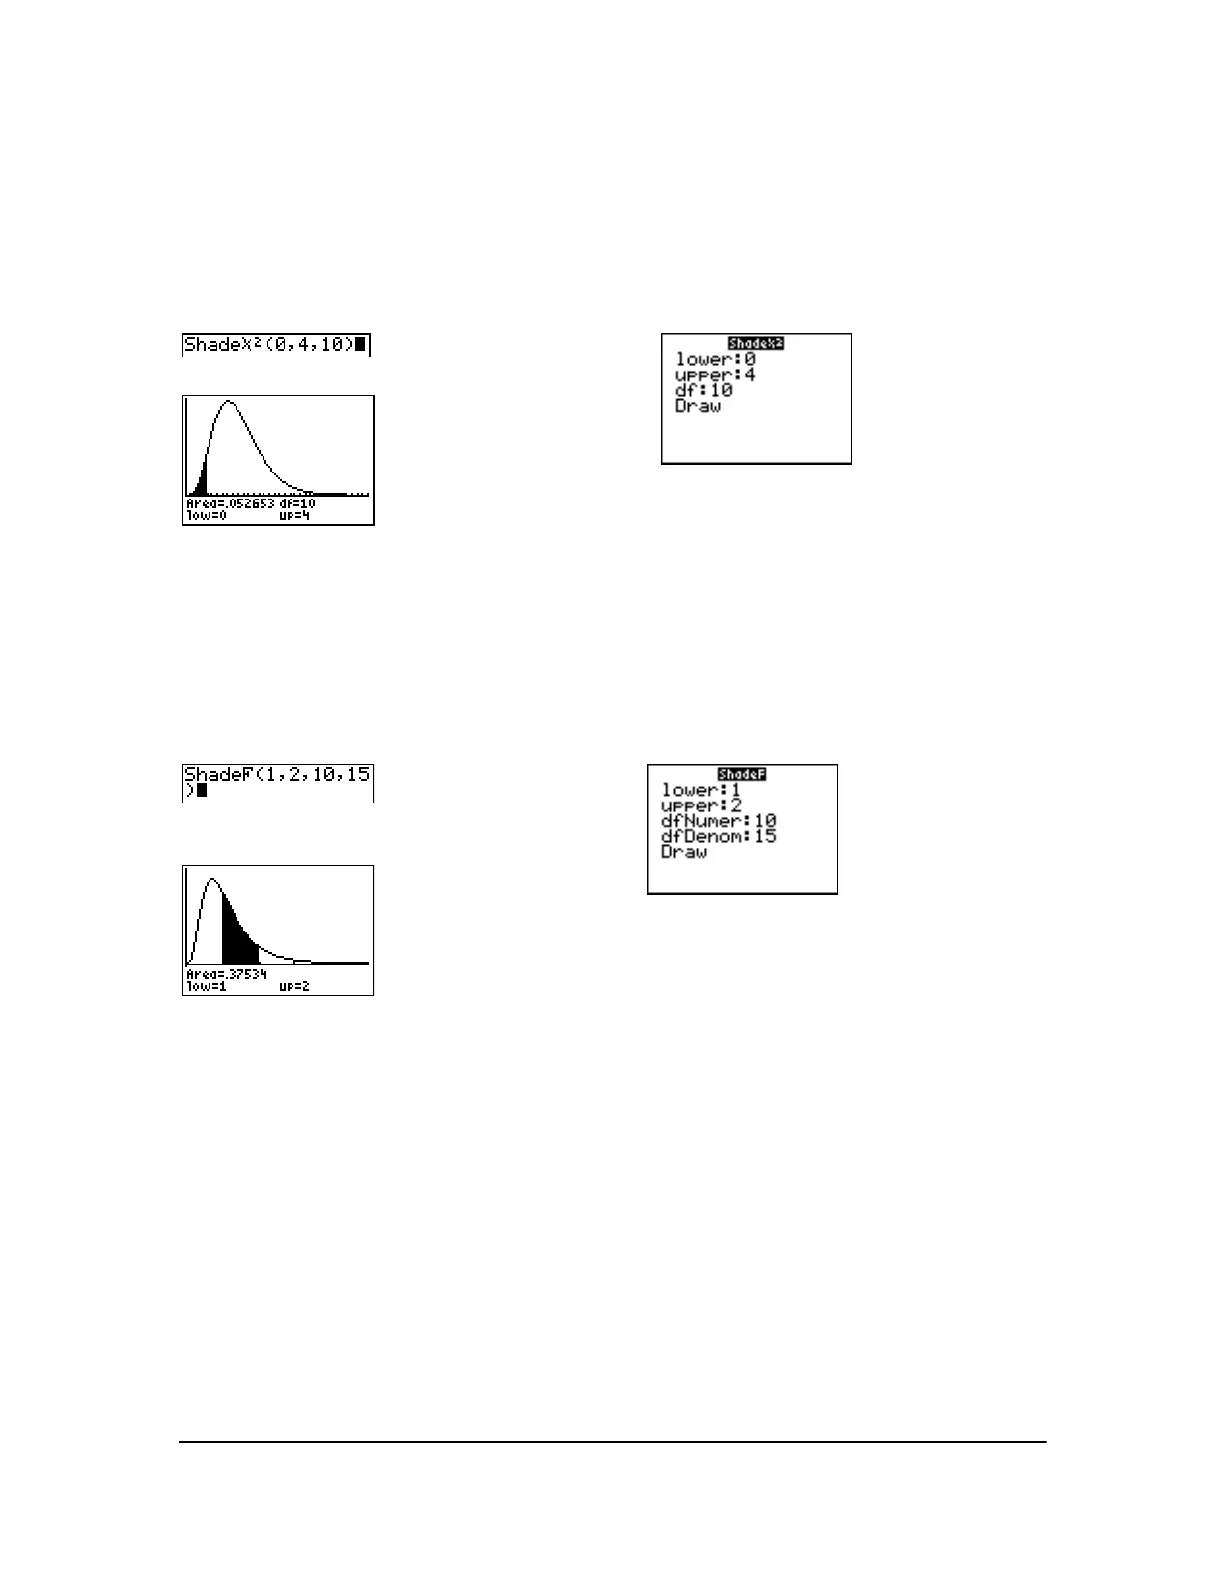
Shadec
2
( draws the density function for the c
2
(chi-square) distribution specified by df (degrees of
freedom) and shades the area between
lowerbound and upperbound.
Shadec
2
(lowerbound,upperbound,df)
Classic
Note: For this example,
Xmin = 0
Xmax = 35
Ymin = L.025
Ymax = .1
ShadeF(
ShadeÜ( draws the density function for the Ü distribution specified by numerator df (degrees of
freedom)
and denominator df and shades the area between lowerbound and upperbound.
ShadeÜ(lowerbound,upperbound,numerator df,denominator df)
Classic
Note: For this example,
Xmin = 0
Xmax = 5
Ymin = L.25
Ymax = .9
 Loading...


