Chapter 17: Activities 301
Zooming In on the Table
You can adjust the way a table is displayed to get more information about a defined function. With
smaller values for @
Tbl, you can zoom in on the table. You can change the values on the TBLSET
screen by pressing y - or by pressing à on the TABLE screen
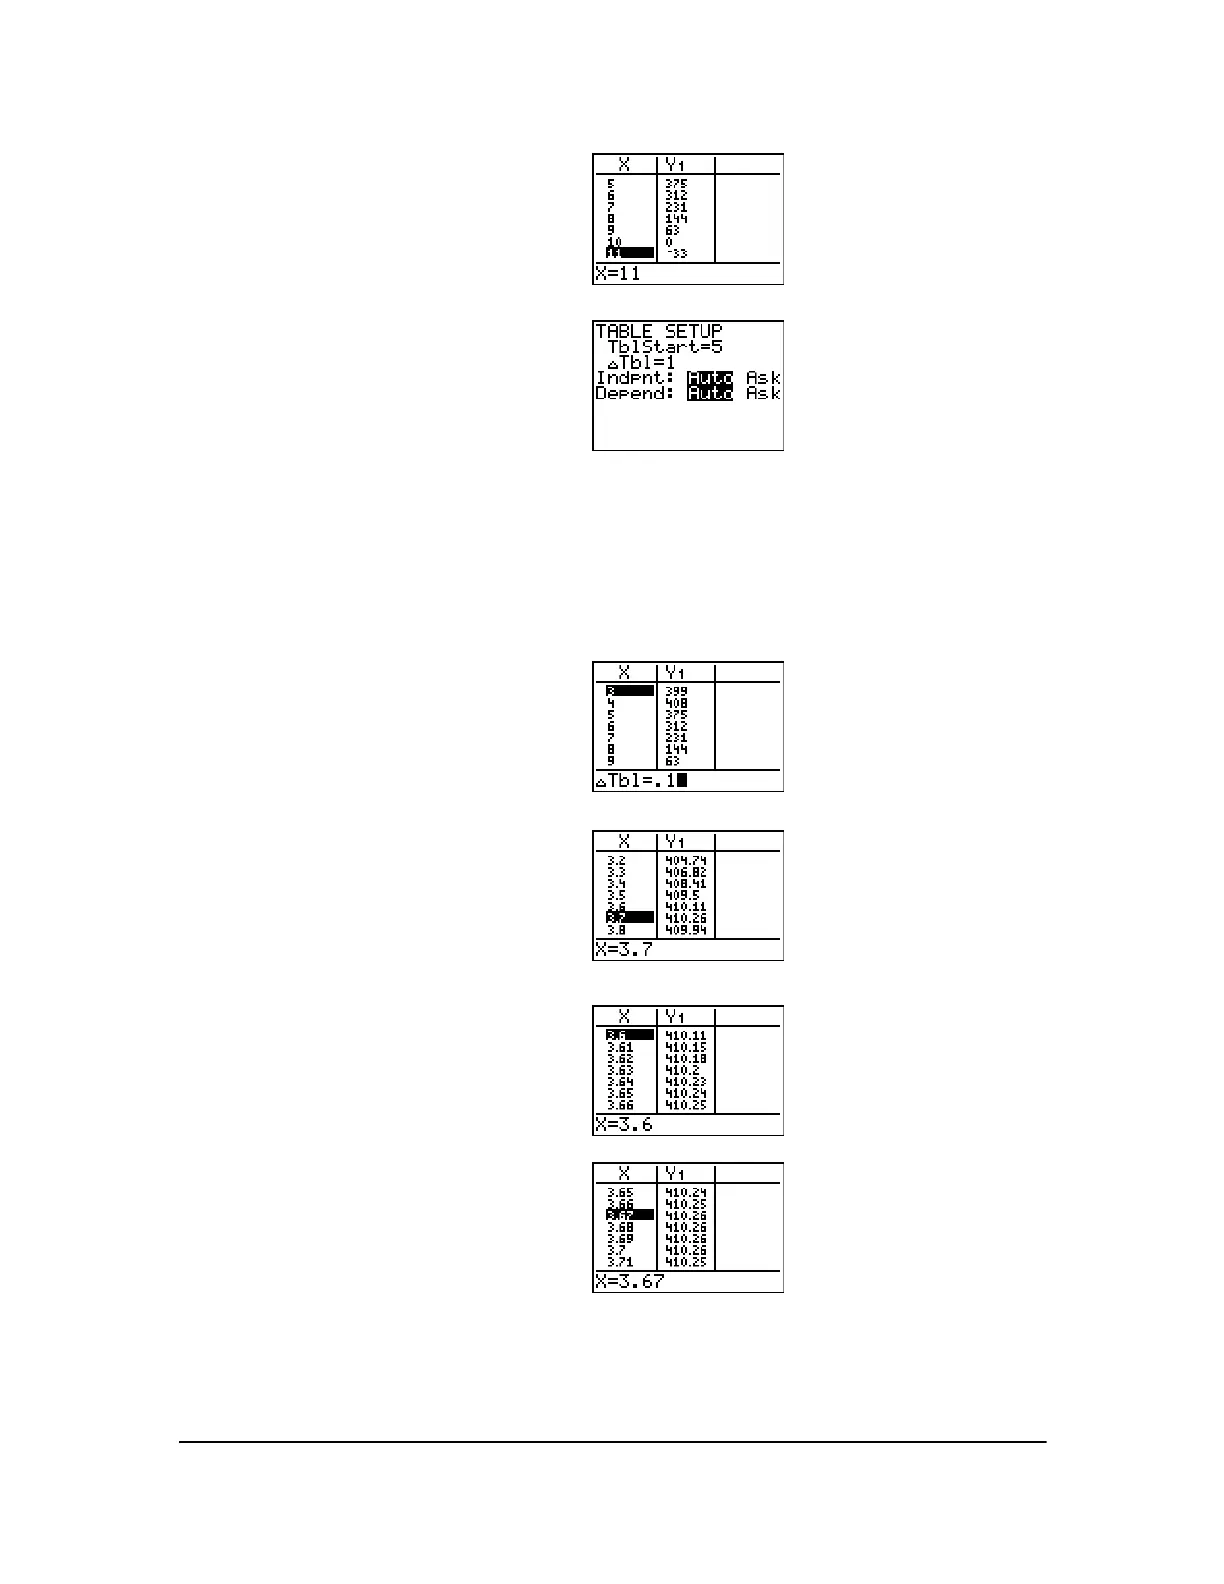
5. Press and hold † to scroll the table until
a negative result for
Y1 is displayed.
Notice that the maximum length of
X for
this problem occurs where the sign of
Y1
(box’s volume) changes from positive to
negative, between
10 and 11.
6. Press y -.
Notice that
TblStart has changed to 5 to
reflect the first line of the table as it was
last displayed. (In step 5, the first value
of
X displayed in the table is 5.)
1. Press y 0.
2. Press } to move the cursor to highlight
3.
3. Press Ã. The @
Tbl displays on the entry
line.
4. Enter
Ë 1 Í. The table updates,
showing the changes in X in increments
of 0.1.
Notice that the maximum value for
Y1 in
this table view is
410.26, which occurs at
X=3.7. Therefore, the maximum occurs
where
3.6<X<3.8.
5. With X=3.6 highlighted, press Ã
Ë 01
Í to set @Tbl=0.01.
6. Press † and } to scroll the table.
Four equivalent maximum values are
shown,
410.26 at X=3.67, 3.68, 3.69, and
3.70.
 Loading...


