74 Previews
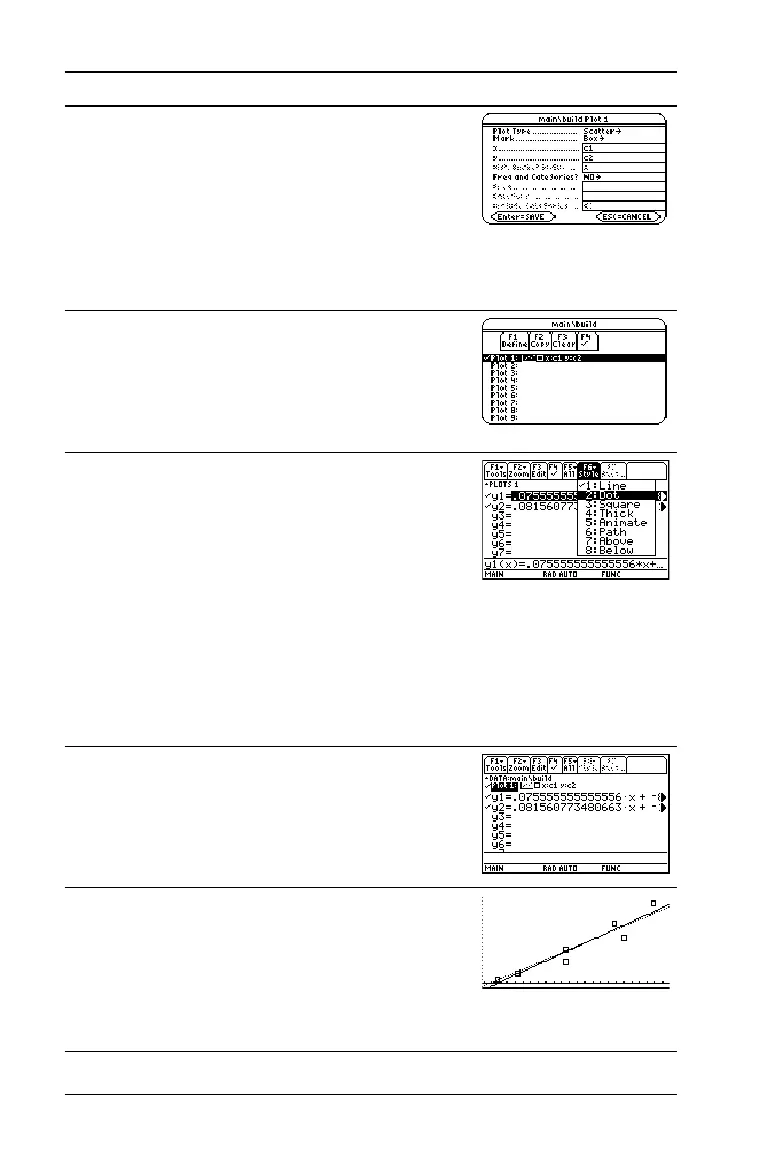
13. Define Plot 1 as:
Plot Type = Scatter
Mark = Box
x = C1
y = C2
Notice the similarities between this and the
Calculate dialog box.
@, B 1 D B 1 D C j 1 D j C2
14. Save the plot definition and return to the
Plot Setup screen.
Notice the shorthand notation for
Plot 1’s
definition.
Press ¸ twice
15. Display the
Y= Editor. For y1(x), the
MedMed regression equation, set the
display style to Dot.
Note: Depending on the previous contents
of your Y= Editor, you may need to move
the cursor to y1.
PLOTS 1 at the top of the screen means that
Plot 1 is selected.
Notice that
y1(x) and y2(x) were selected
when the regression equations were stored.
@8 # 2 ˆ 2
16. Scroll up to highlight
Plot 1.
The displayed shorthand definition is the
same as on the Plot Setup screen.
Press C
17. Use ZoomData to graph Plot 1 and the
regression equations y1(x) and y2(x).
ZoomData examines the data for all
selected stat plots and adjusts the viewing
window to include all points.
Press „ 9
Steps and keystrokes Display
 Loading...


