Previews 75
18. Return to the current session of the
Data/Matrix Editor.
Press 2a
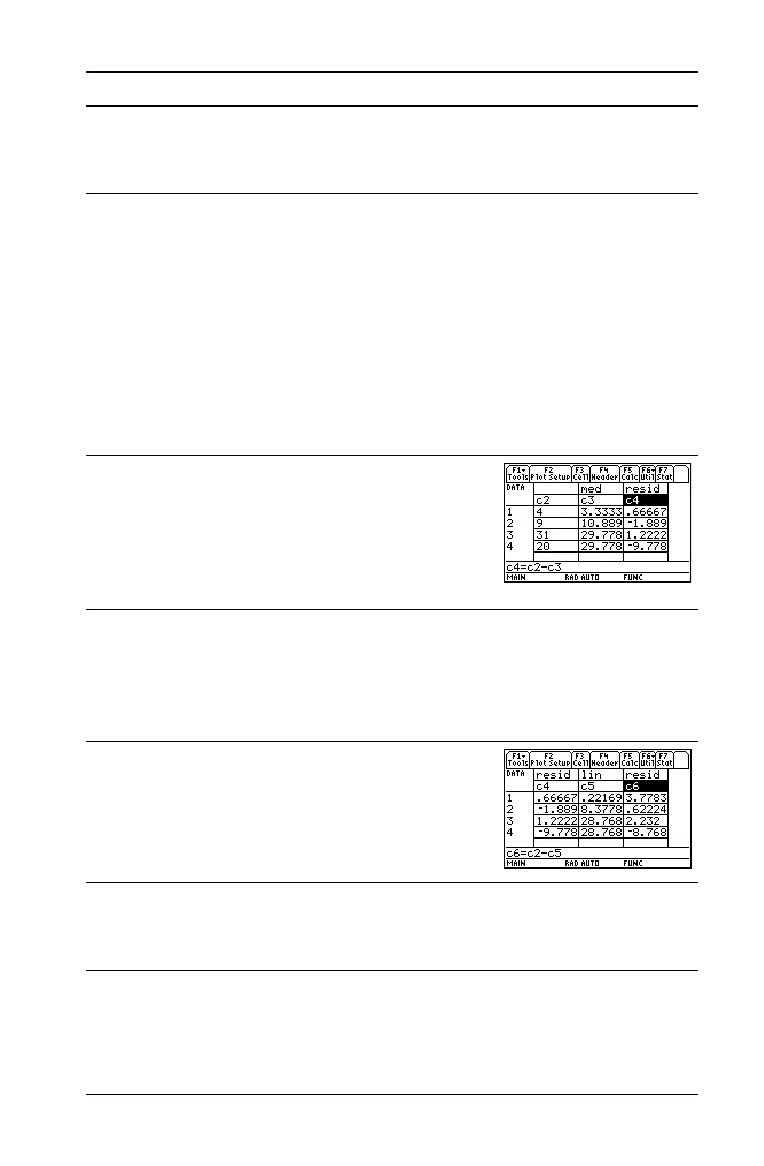
19. Enter a title for column 3. Define column 3’s
header as the values predicted by the
MedMed line.
To enter a title, the cursor must highlight
the title cell at the very top of the column.
† lets you define a header from anywhere
in a column. When the cursor is on a header
cell, pressing † is not required.
@B B C C 2 ™ MED j ¸
† Y1 c j C1 d ¸
20. Enter a title for column 4. Define column 4’s
header as the residuals (difference between
observed and predicted values) for
MedMed.
@B C 2 ™ RESID j ¸ j
C2 | j C3 ¸
21. Enter a title for column 5. Define column 5’s
header as the values predicted by the
LinReg line.
@B C C 2 ™ LIN j ¸ † Y2
c j C1 d ¸
22. Enter a title for column 6. Define column 6’s
header as the residuals for LinReg.
@B C 2 ™ RESID j ¸ †
j C2 | j C5 ¸
23. Display the Plot Setup screen and deselect
Plot 1.
Press „ †
Steps and keystrokes Display
 Loading...


