76 Previews
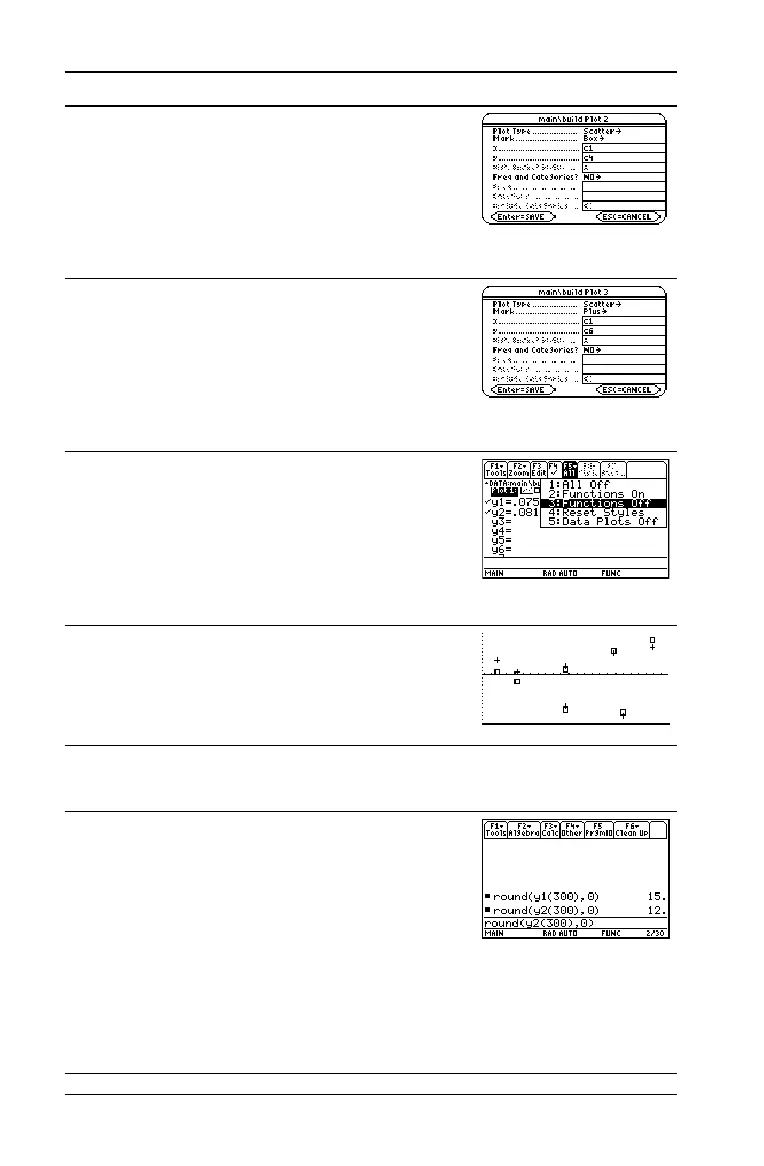
24. Highlight Plot 2 and define it as:
Plot Type = Scatter
Mark = Box
x = C1
y = C4
(MedMed residuals)
@D , D D C j 1 D j C4 ¸
¸
25. Highlight
Plot 3 and define it as:
Plot Type = Scatter
Mark = Plus
x = C1
y = C6
(LinReg residuals)
@D , D B 3 D C j 1 D j C6
¸ ¸
26. Display the
Y= Editor and turn all the y(x)
functions off.
From ‡, select 3:Functions Off, not
1:All Off.
Plots 2 and 3 are still selected.
Press 8 # ‡ 3
27. Use ZoomData to graph the residuals.
› marks the MedMed residuals;
+ marks the LinReg residuals.
Press „ 9
28. Display the Home screen.
@ "
29. Use the MedMed (
y1(x)) and LinReg (y2(x))
regression equations to calculate values for
x = 300 (300,000 population).
The
round function (2I13) ensures
that results show an integer number of
buildings.
After calculating the first result, edit the
entry line to change
y1 to y2.
Press 2 I 1 3 Y1 c 300 d b 0 d
¸ B A (eight times) 0 2 ¸
Steps and keystrokes Display
 Loading...


