6.1 PM100D Utility Software
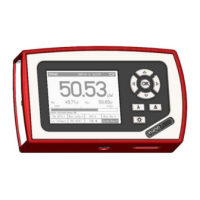
measurement value gets displayed ‘T’ indicator and green light.
Left Sub Display
The display has the following configurable items:
- no display
- maximum value - sampling until reset
- ratio max/min value - sampling until reset
- power or energy density
- alternate unit depending on connected sensor
the possible choices depend on the connected sensor
Right Sub Display
The display has the following configurable items, the possible choices depend on
the connected sensor::
- no display
- minimum value - sampling until reset
- frequency or repetition rate
- temperature
- resistance of temperature sensor
Bargraph indicator
The bargraph indicator shows the incidence or the used measurement range.
Statistics screen
Statistical values in linear and logarithmic representation
Data logging screen
Shows the logging history data
Histogram Power / Energy histogram
- displays histogram data
Chart display
Power/Energy Chart
Range button
Press to open a dialog box for setting the measurement range
The indicator in the button shows the currently used measurement range in the
chosen unit. A green light indicates 'auto-ranging'
Shortcut: [Shift + F1]
Wavelength / Response button
Press this button to open a dialog box for setting the correction wavelength, or in
adapter mode to enter the responsivity value in A/W or V/W.
The currently used parameter is indicated in the button label.
Shortcut: [Shift + F2]
Measurement configuration button
Depending on the connected sensor the following parameters can be set in the
dialog box:
- display resolution - set number of digits
39