10
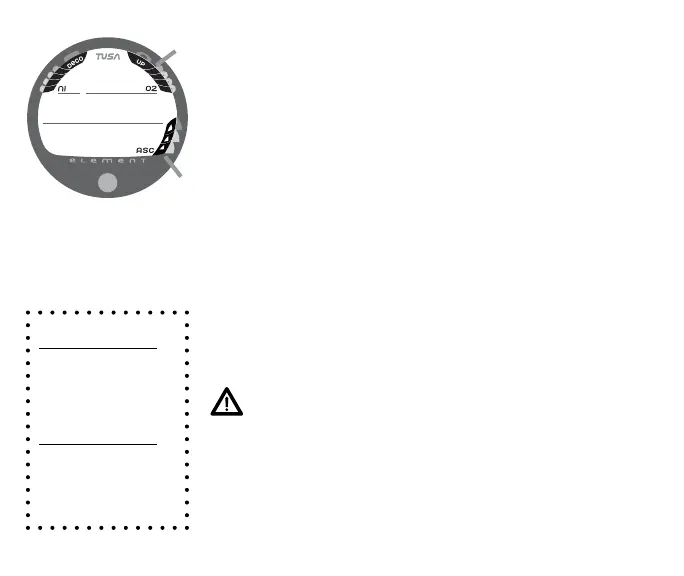
Oxygen Accumulation Bar Graph (O2BG)
The O2BG (Fig. 2a) represents oxygen accumulation, showing
the maximum of either per dive accumulated oxygen, or 24 hour
period accumulated oxygen.
As your oxygen exposure (accumulation) increases during the
dive, segments will add to the O2BG, and as loading de-
creases, it will begin to recede, indicating that additional
exposure is allowed for that dive and 24 hour period.
Ascent Rate Indicator (ASC)
The ASC (Fig. 2b) provides a visual representation of ascent
speed (i.e., an ascent speedometer).
The segments of the ASC represent two sets of speeds which
change at a reference Depth of 60 FT (18 M). Refer to the chart
for segment values.
WARNING: At depths greater than 60 FT (18 M),
ascent rates should not exceed 60 feet per minute
(18 meters per minute). At depths of 60 FT (18 M)
and shallower, ascent rates should not exceed 30
feet per minute (9 meters per minute).
Fig. 2 - O2BG and ASC
ASC values
Deeper than 60 FT (18 M)
Segments Ascent Rate =
Displayed FPM MPM
0 0 - 20 0 - 6
1 21-50 6.5-15
2 51-60 15.5-18
3 >60 >18
60 FT (18 M) & Shallower
Segments Ascent Rate =
Displayed FPM MPM
0 0 - 10 0 - 3
1 11-25 3.5-7.5
2 26-30 8-9
3 >30 >9
a
b