32
NIBG (NITROGEN LOADING BAR GRAPH) (Fig. 26a)
As your Depth and Elapsed Dive Time (EDT) increase, the NiBG
will add segments to represent the absorption of nitrogen.
While ascending to shallower depths, the number of segments
displayed will begin to recede, offering a graphic representation
of your multilevel diving capability.
O2BG (OXYGEN ACCUMULATION BAR GRAPH) (Fig. 26b)
If FO2 was set for a numerical value (Nitrox), the O2BG will
add segments to represent oxygen accumulation for that dive, or
24 hour period, whichever amount is greater.
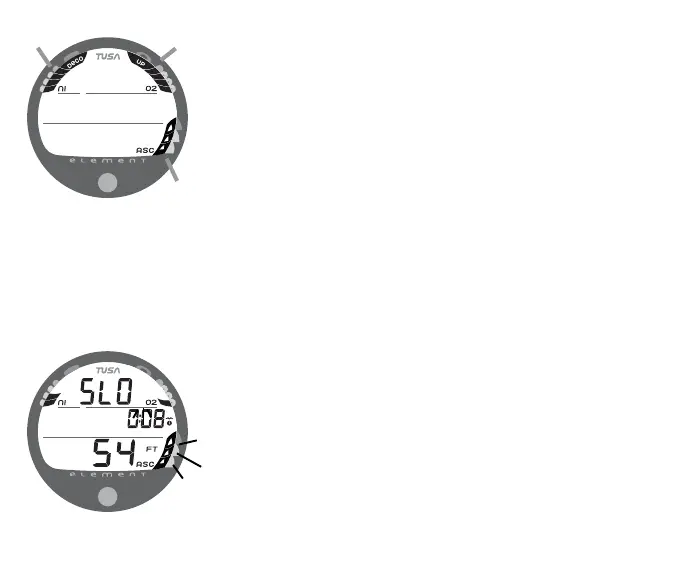
ASC (ASCENT RATE INDICATOR) (Fig. 26c)
The Ascent Rate Indicator (ASC) shows how fast you are ascend-
ing. When you exceed the maximum recommended ascent rate
for the depth you are at (see chart on page 10), all segments of
the ASC will flash (Fig. 27). The flashing will stop when your
Ascent Rate is slowed below the alarm value.
Fig. 26 - BAR GRAPHS
Fig. 27 - ASCENT TOO FAST
a
c
b