Waves eMotion LV1 Classic User Guide | Chapter 3: Setup
Window
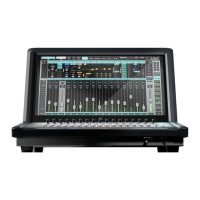
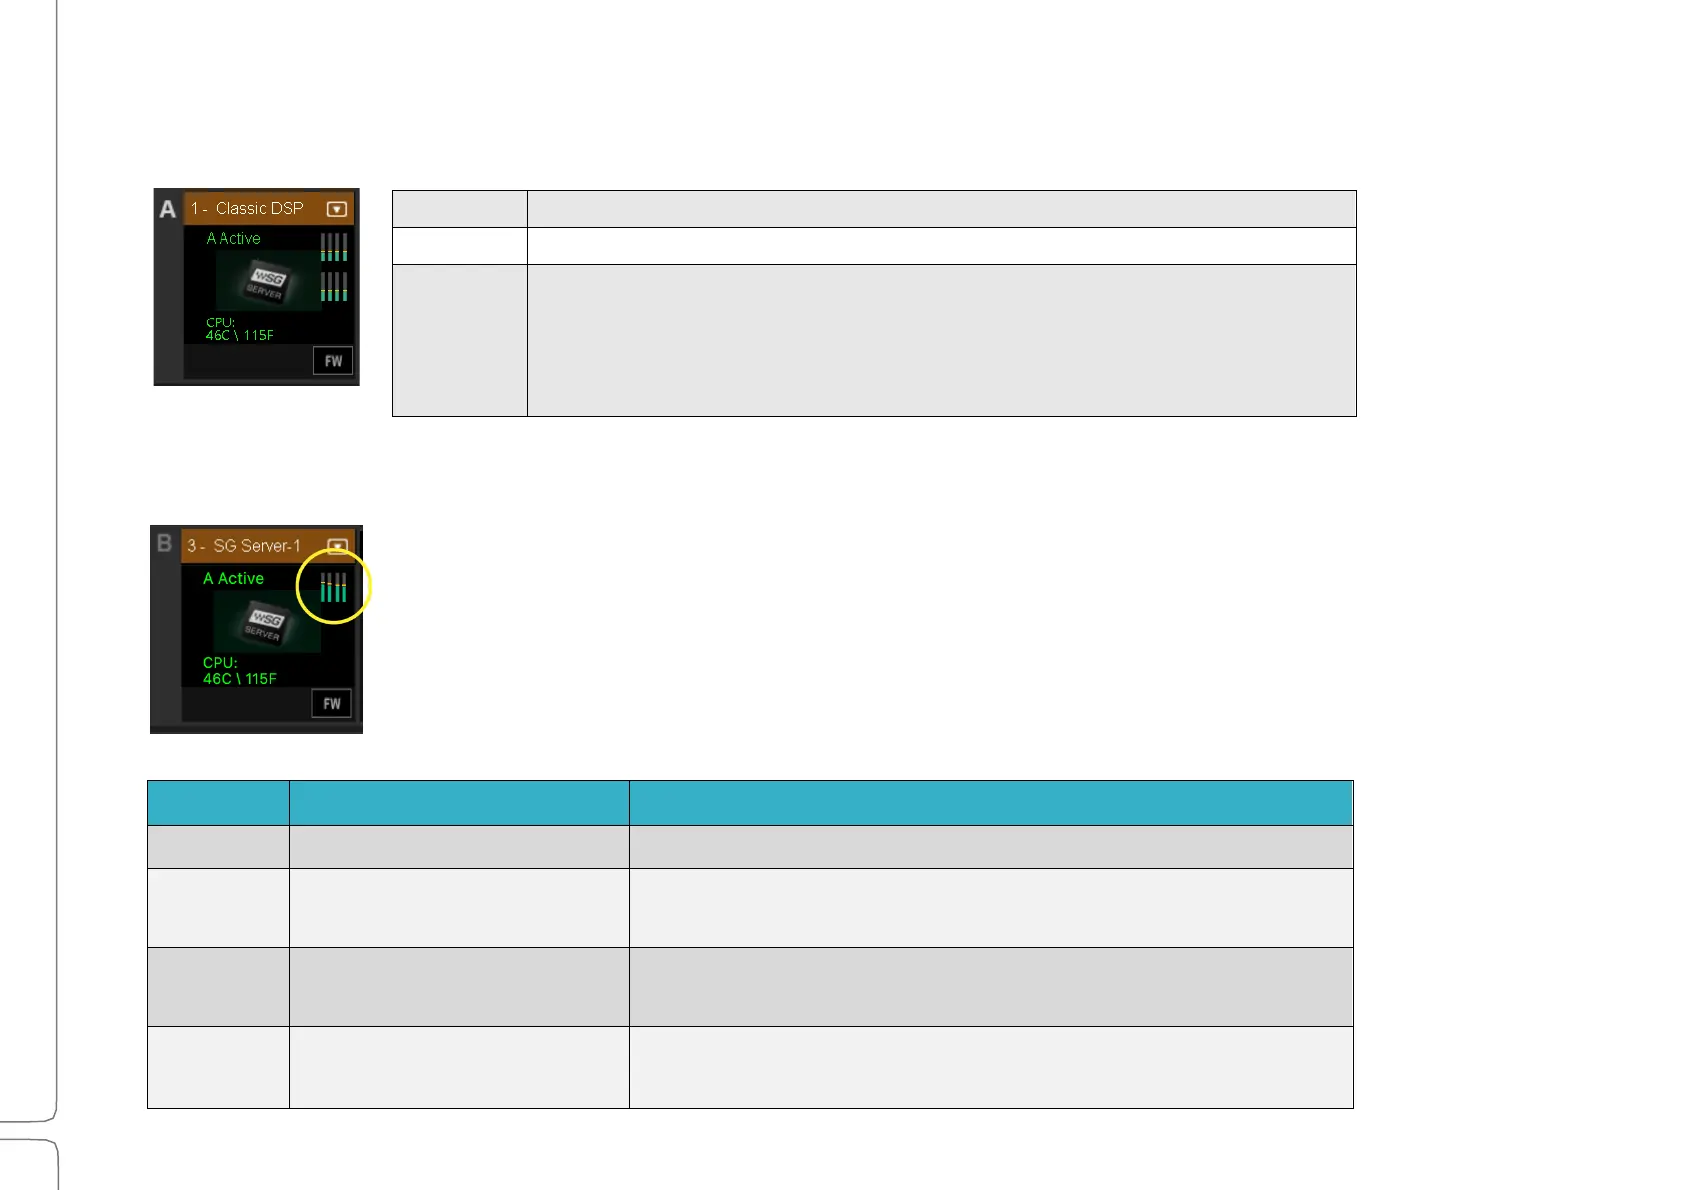
Server Indicators on the Icon
Server Status is indicated by the color of the text displayed on the server icon.
The server is present and operational.
The server is assigned but is not available. “N/A” is displayed
The server is in an error state. Possible causes include:
• The device has crashed.
• The device is not in sync.
• The device firmware is incompatible with current version of SoundGrid Studio
software.
DSP Meters
The meter bars on a server icon indicate DSP usage of each of the server’s cores. There is
one meter per core.
The solid bar areas display average DSP use per core. The yellow lines indicate peak usage,
which is also displayed as a percentage above the line. Certain plugins can exhibit a high
average/peak DSP ratio. This may cause overloads (momentary or constant) that result in
audio drops. When adding many of these CPU-intensive plugins, the peak and average
indicators will drift apart. In such cases, you may need to disable or remove certain plugins.
DSP peak value: 1% to 84%
System is stable. You can add more plugins.
DSP peak value: 1% to 84%
Monitor the meter status and be prepared to remove some plugins
and/or increase the network buffer size.
DSP peak value: 85% to 99%
Monitor the DSP meter status. Remove some plugins and/or
increase the network buffer size.
DSP load is beyond the limit. Remove heavy-load plugins
immediately.