Operation
0420−1/A1
Winterthur Gas & Diesel Ltd.
1/ 3
Indicator Diagrams
1. General
Indicator diagrams must only be drawn with a serviceable indicator at constant power
and speed, and ships sailing in calm sea and deep water.
To give you data about the indication diagrams, record the related cylinder number,
engine speed, the positions of the load indicator and VIT.
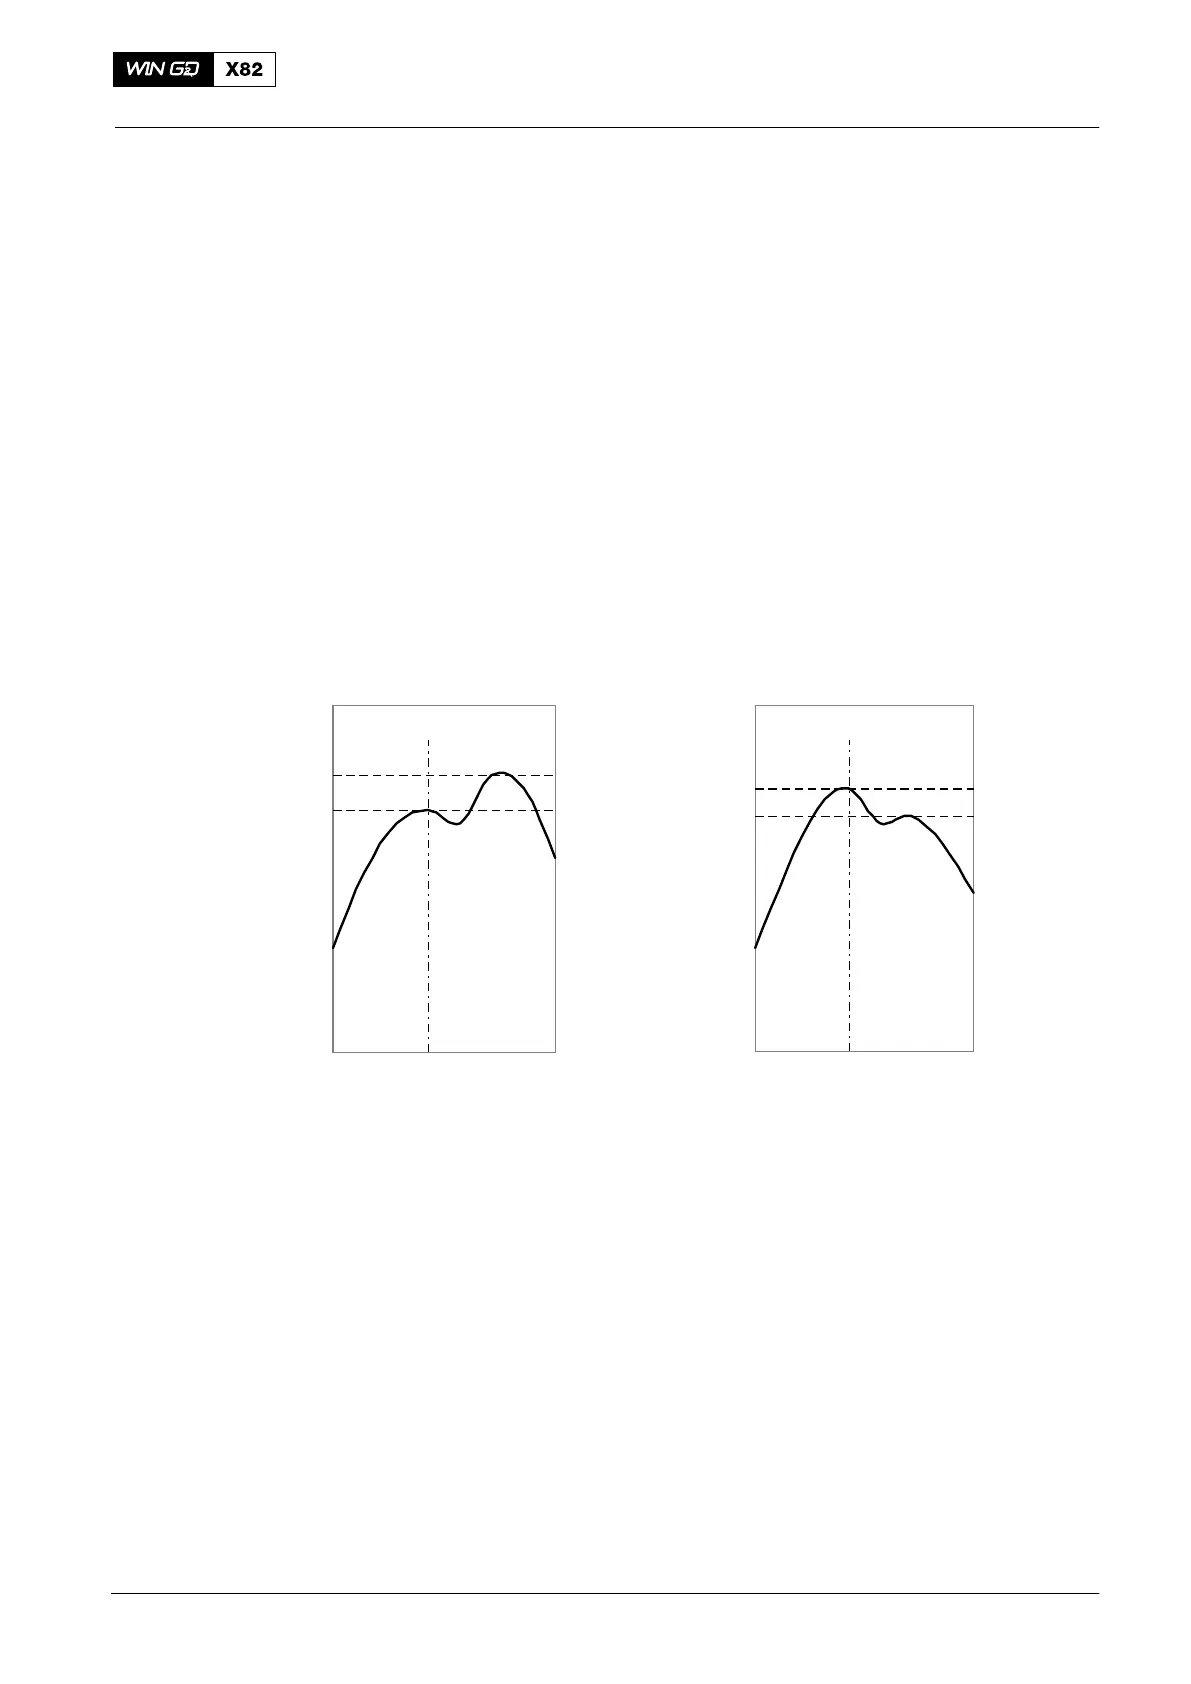
2. Description of Cylinder Pressures
Higher compression ratio and fuel injection delay are used to decrease the NO
x
value
for engines so that the IMO rules are obeyed.
The ratio of the maximum firing pressure to the compression pressure is in the range
of 0.90 to 1.25 at 100% load.
The engine rating is related to IMO tuning. This means that the curves in the diagram
can be different in the two examples that follow:
Example A Example B
Crank angle [_CA]Crank angle [_CA]
Cylinder pressure [bar]
Cylinder pressure [bar]
P
C
= Compression pressure at TDC P
F
= maximum firing pressure
p
F
p
C
p
F
p
C
Fig. 1: Compression Ratios
3. Indicator Diagrams and Related Engine Adjustments
The diagrams, which were made during the acceptance trial, must be used as
references. For reference values about compression and maximum firing pressures
for the related load and speed, refer to the trial reports and performance curves.
2014
Operation − Special Procedures