Wi-Fi Array
140 Viewing Status on the Wi-Fi Array
IAPs
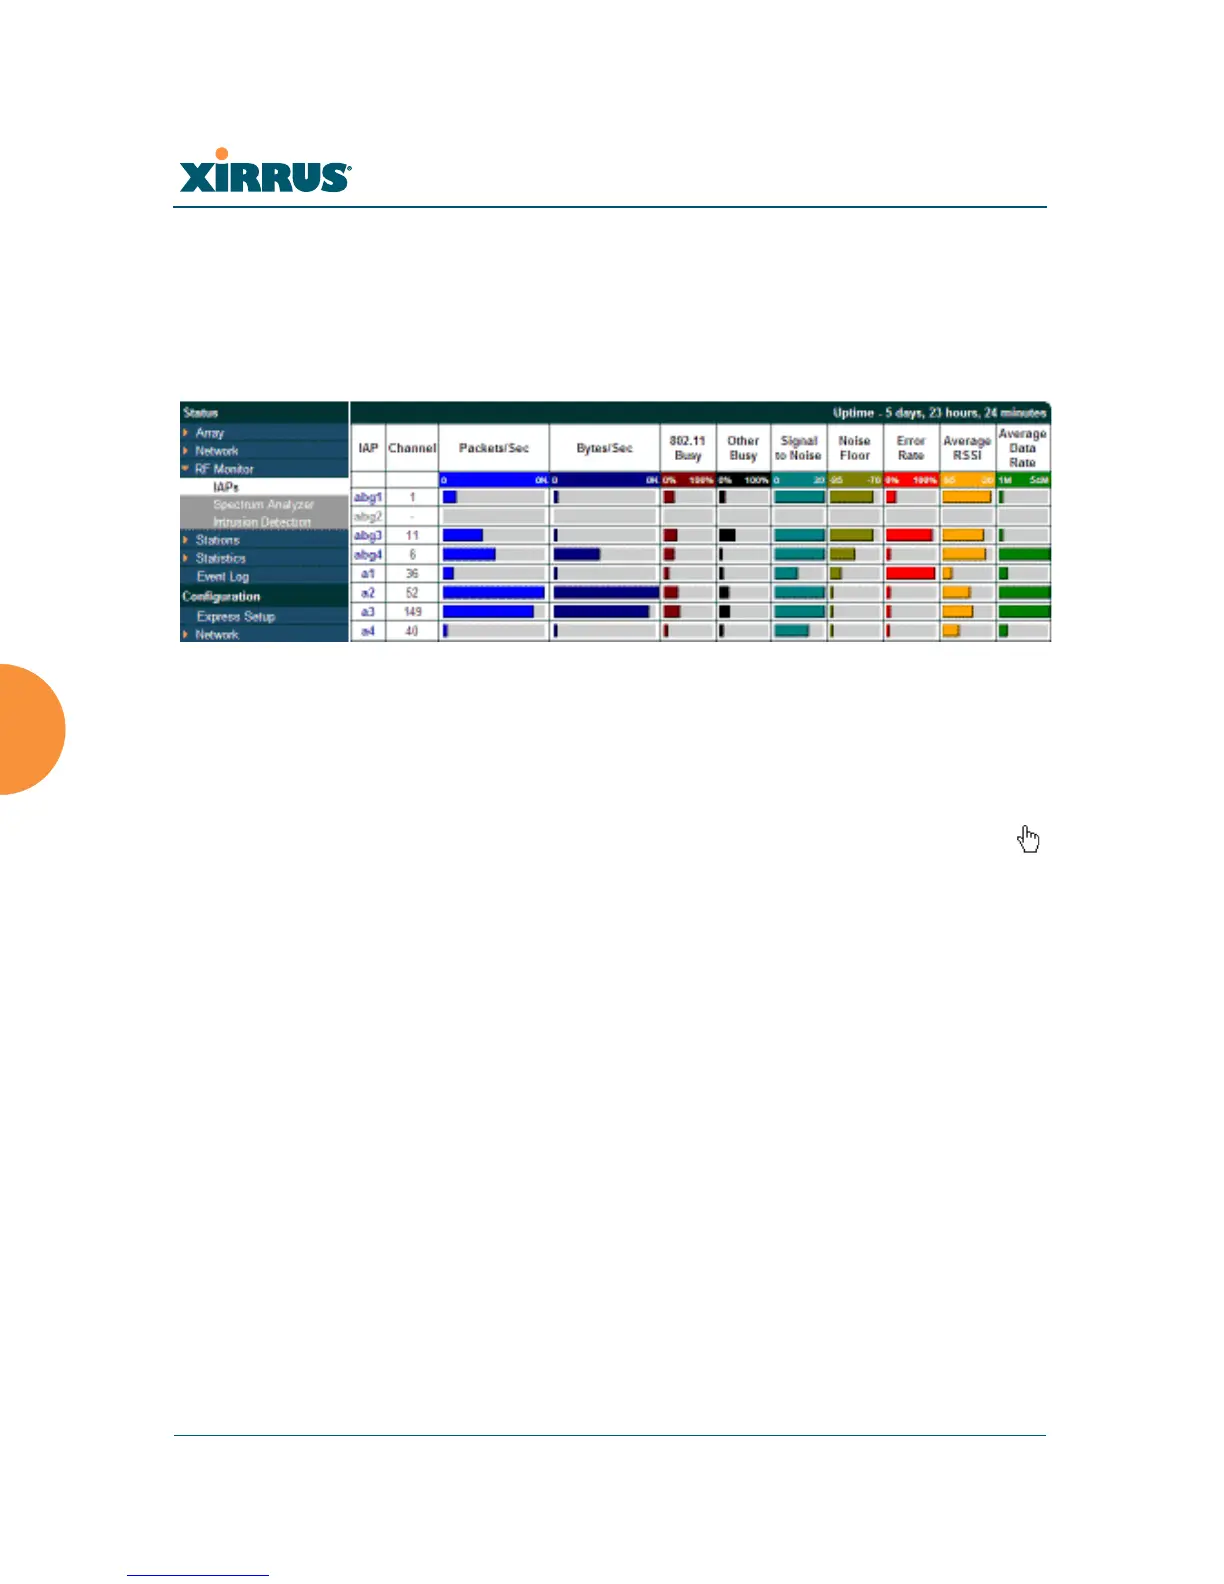
The RF Monitor — IAPs window displays traffic statistics and RF readings
observed by each Array IAP (radio). Note that the data is an instantaneous
snapshot for the IAP — it is not an average or a cumulative total.
Figure 61. RF Monitor — IAPs
Figure 61 presents the data as a graphical display, enabled by selecting the Graph
checkbox on the lower left. If this option is not selected, data is presented as a
numerical table. You may sort the rows based on any column that has an active
column header, indicated when the mouse pointer changes to the hand icon .
Click Refresh to update the information at any time. Click Auto Refresh to
instruct the Array to refresh this window automatically.