Wi-Fi Array
Viewing Status on the Wi-Fi Array 153
Working with the Custom Image
After you have uploaded a custom image (see Custom Image and Upload in
“Controls and items displayed on the Location Map window” on page 150), you
should move the display of the Array on your map to correspond with its actual
location at your site.
To move the Array on the map, simply click it, then drag and drop it to the
desired location. The Array will continue to follow the mouse pointer to allow
you to make further changes to its location. When you are satisfied with its
location, click the Array again to return to normal operation.
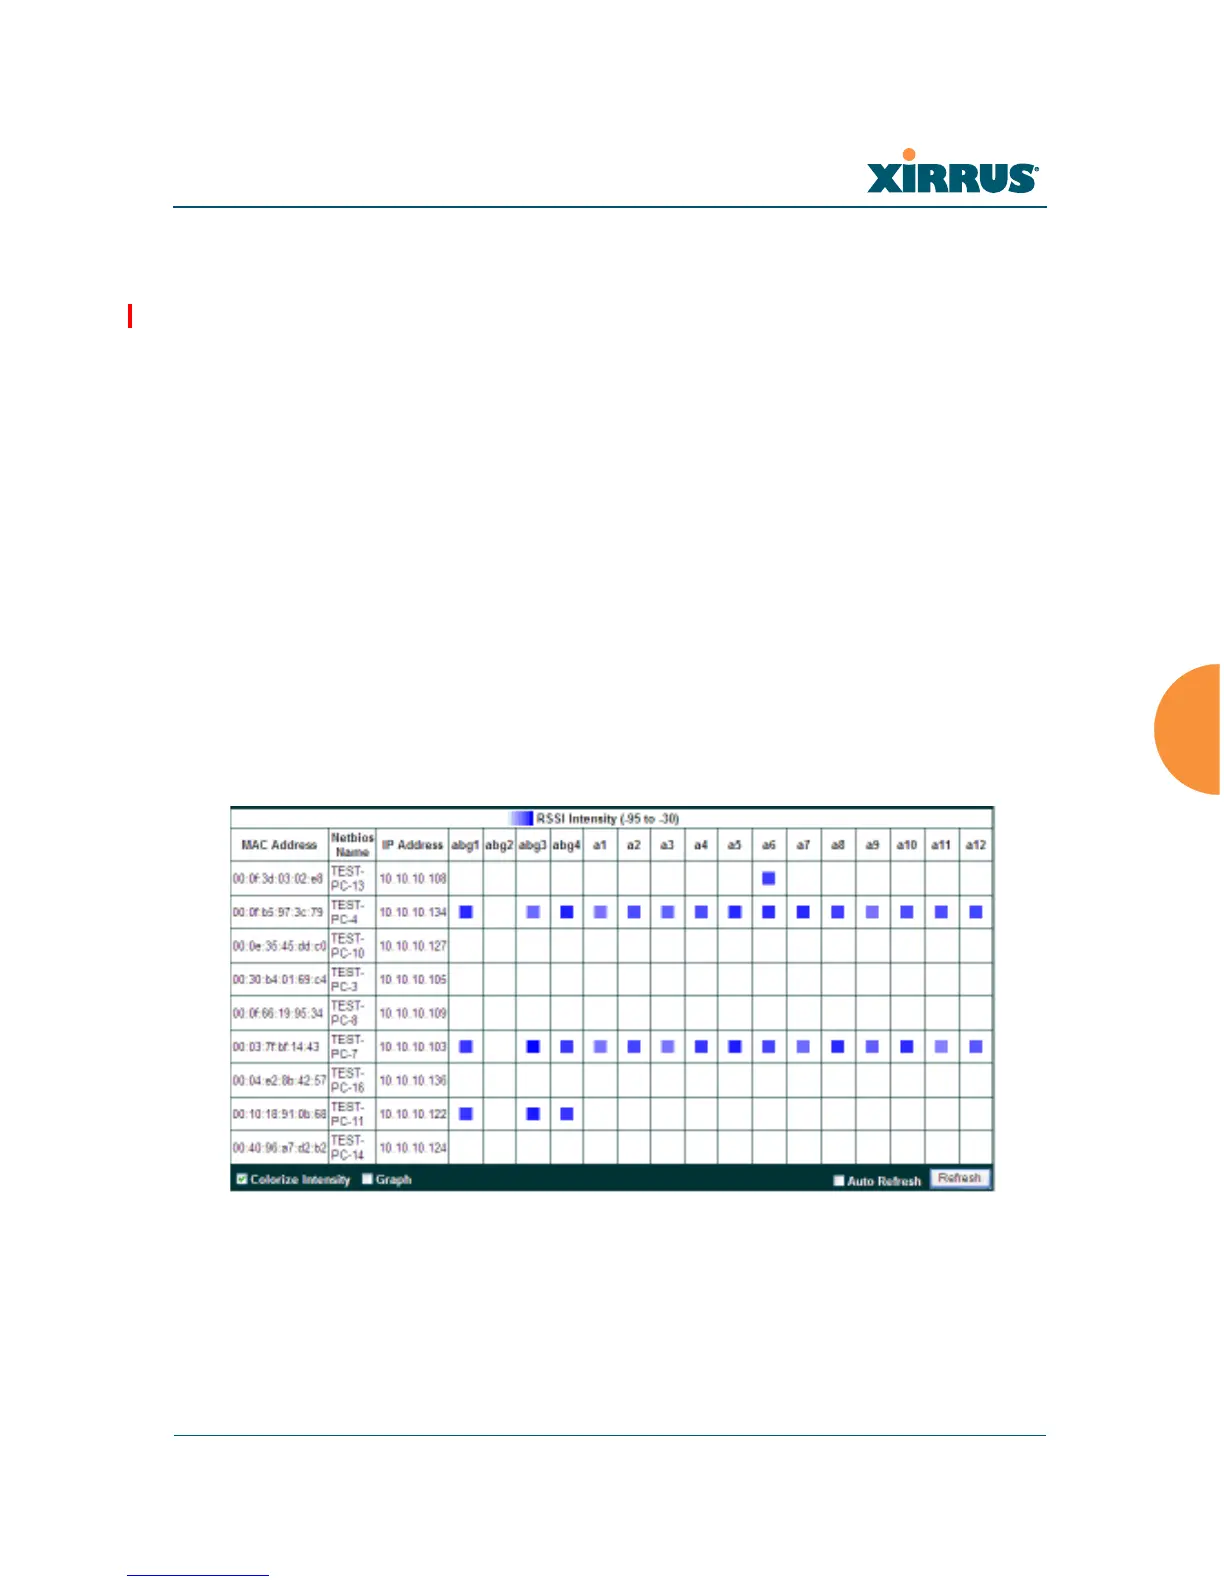
RSSI
For each station that is associated to the Array, the RSSI (Received Signal Strength
Indicator) window shows the station’s RSSI value as measured by each IAP. In
other words, the window shows the strength of the station’s signal at each radio.
You may choose to display Unassociated Stations as well with a checkbox at the
bottom of the window.
Figure 68. Station RSSI Values
By default, the RSSI is displayed numerically. You may display the relative
strength using color if you select Colorize Intensity, with the strongest signals
indicated by the most intense color. (Figure 68) If you select Graph, then the RSSI
is shown on a representation of the Array, either colorized or numerically based