5-78 <5. Functions of CQ1 Software>
IM 80J01A01-01E
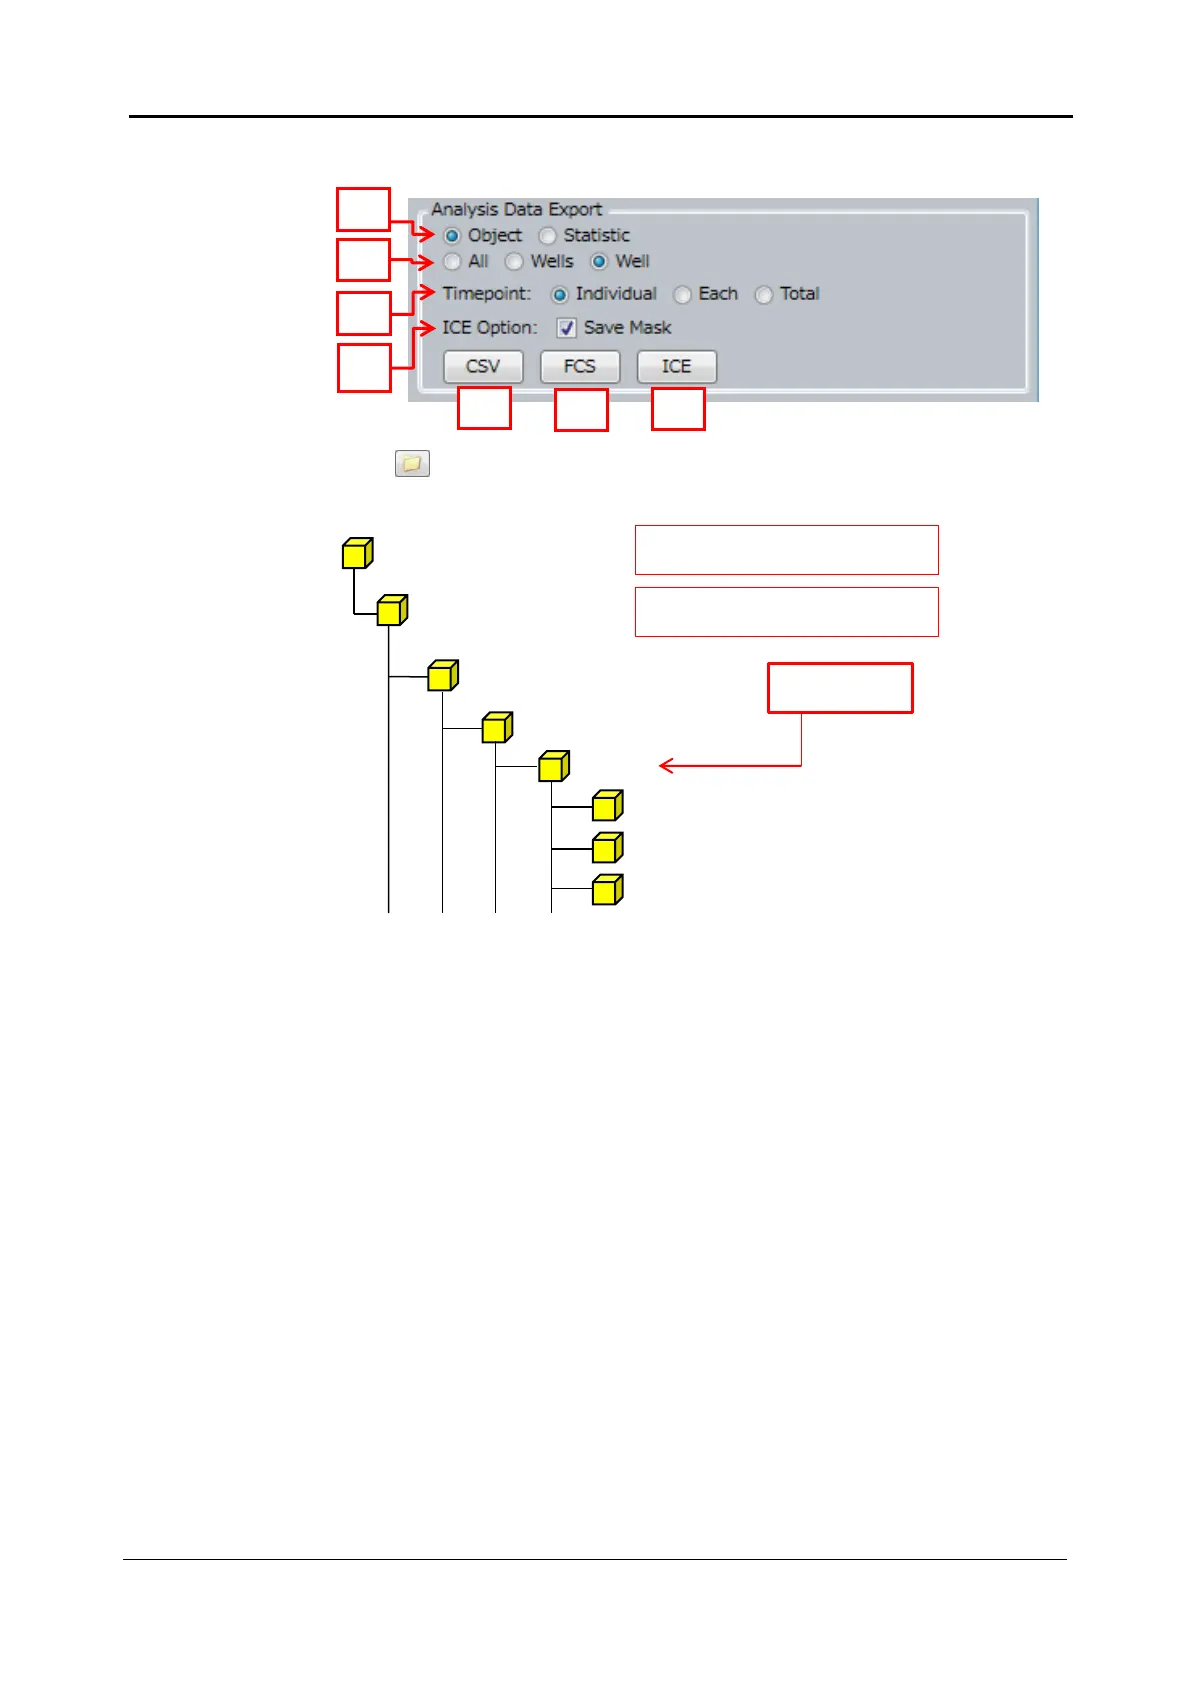
(2) Analysis Data Export
Click button in “Image Export” to open Report folder. Report folder
is generated in following path.
Output Items
Select output items.
“Object” is to output feature data of each cell, and “Statistic” is to
output statistic of feature data per each well
Output Range (Well)
Select output data range. “All” is to cover all analyzed wells, “Wells”
is to cover selected wells (yellow wells in WellTable) and “Well” is
to cover currently selected wells (wells in green area in WellTable)
Output Range (Timepoint)
Select time point range to output as follows
Individual: Time points of currently selected range
Each: All analyzed time points
(data file is devided corresponding to each time point)
Total: All analyzed time points
(all time points data is saved in one file)
Folder designated in “Protocol”
tab→”Save Folder Name”
Folder designated in “Protocol”
tab→”Save Setting”
Report folder
 Loading...