Chapter 5 Analyze the Relative Standard Curve Experiment
Analyze the Experiment
79
Applied Biosystems 7500/7500 Fast Real-Time PCR System Getting Started Guide for Relative Standard Curve
and Comparative C
T
Experiments
Notes
6. See “Navigation Tips” on page 80 for information on navigating within the analysis
screens.
Preparing the
Experiment for
Review
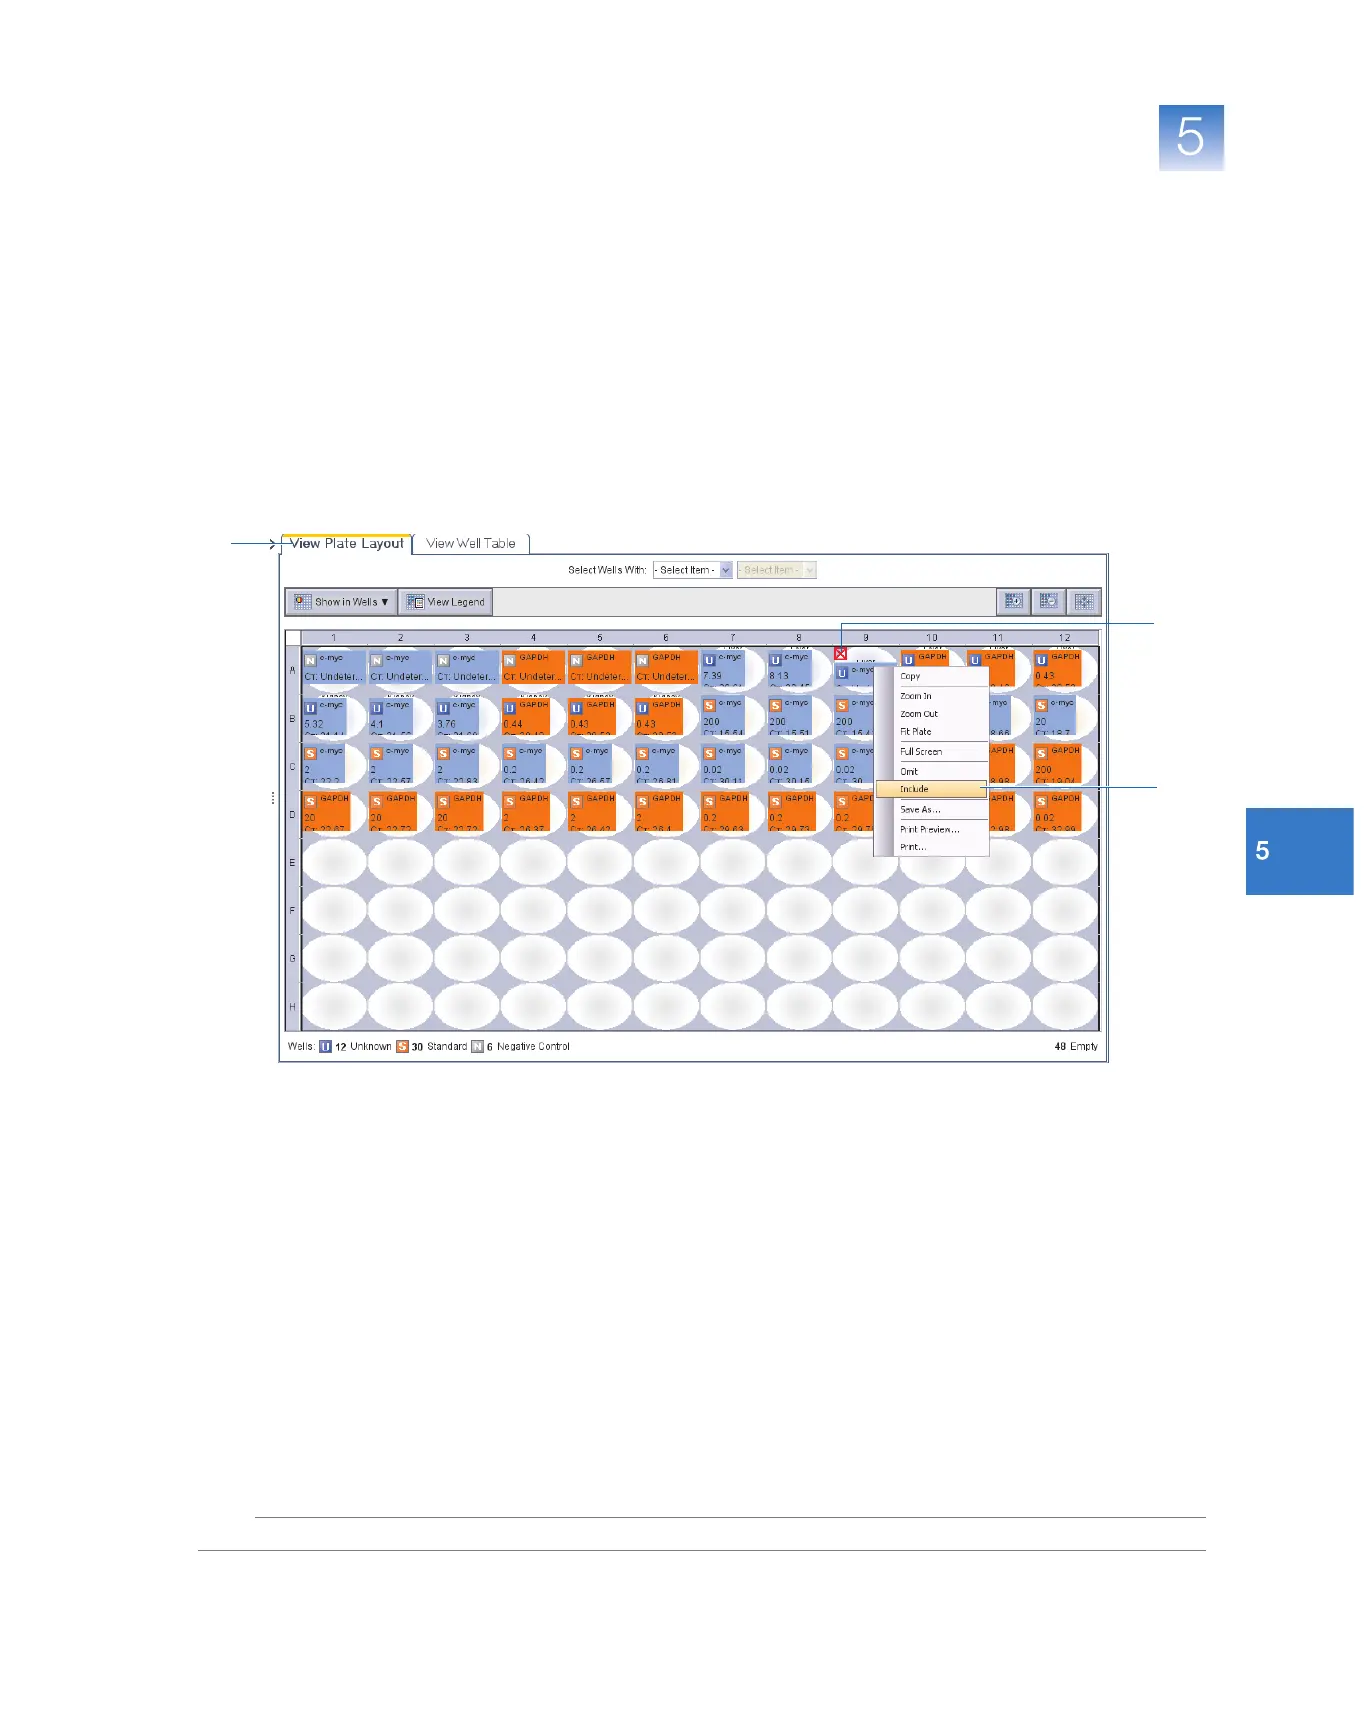
The example file contains a single outlier (well A9) that has been omitted from the
analysis for you. To use the experiment file with this chapter, you must include the well
and reanalyze the experiment.
1.
Select the
View Plate Layout
tab, then select the outlier well that is marked (well A9).
2. Right-click
well A9
, then select Include.
3. Click Analyze. The software analyzes the data using the default analysis settings.
outlier
1
2