Chapter 5 Analyze the Relative Standard Curve Experiment
View the Amplification Plot
Applied Biosystems 7500/7500 Fast Real-Time PCR System Getting Started Guide for Relative Standard Curve
and Comparative C
T
Experiments
86
Notes
View the Plot
1. In the navigation pane, select Analysis Amplification Plot.
Note: If no data are displayed, click Analyze.
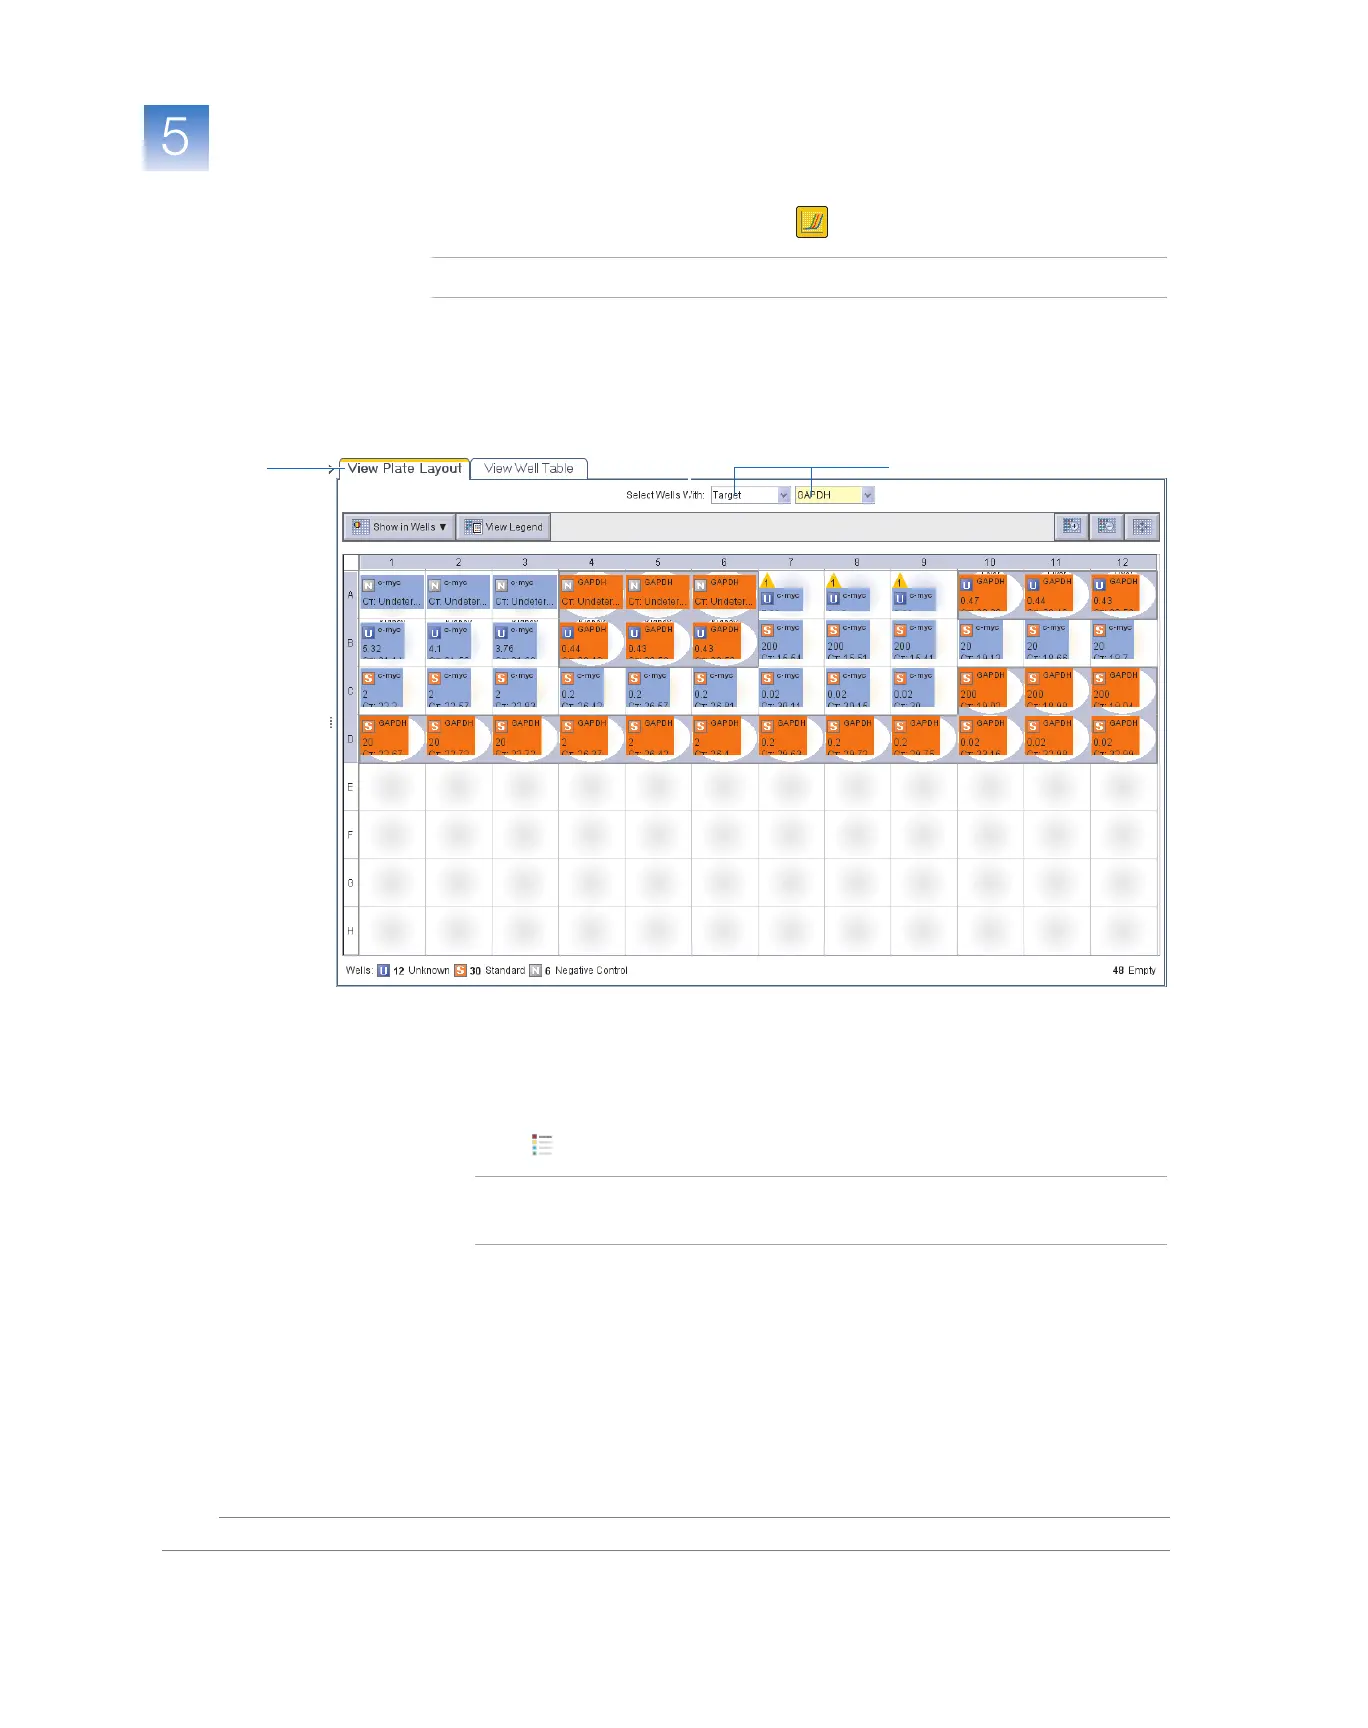
2. Display the GAPDH wells in the Amplification Plot screen:
a. Select the View Plate Layout tab.
b. In the Select Wells With drop-down lists, select Target , then GAPDH.
3. In the Plot Settings tab of the Amplification Plot:
a. In the Plot Type drop-down list, select ∆Rn vs Cycle (default).
b. In the Plot Color drop-down list, select Wel l .
c. Click (Show a legend for the plot).
Note: This is a toggle button. When the legend is displayed, the button changes
to Hide the plot legend.
2a
2b