Chapter 5 Analyze the Relative Standard Curve Experiment
View the Amplification Plot
89
Applied Biosystems 7500/7500 Fast Real-Time PCR System Getting Started Guide for Relative Standard Curve
and Comparative C
T
Experiments
Notes
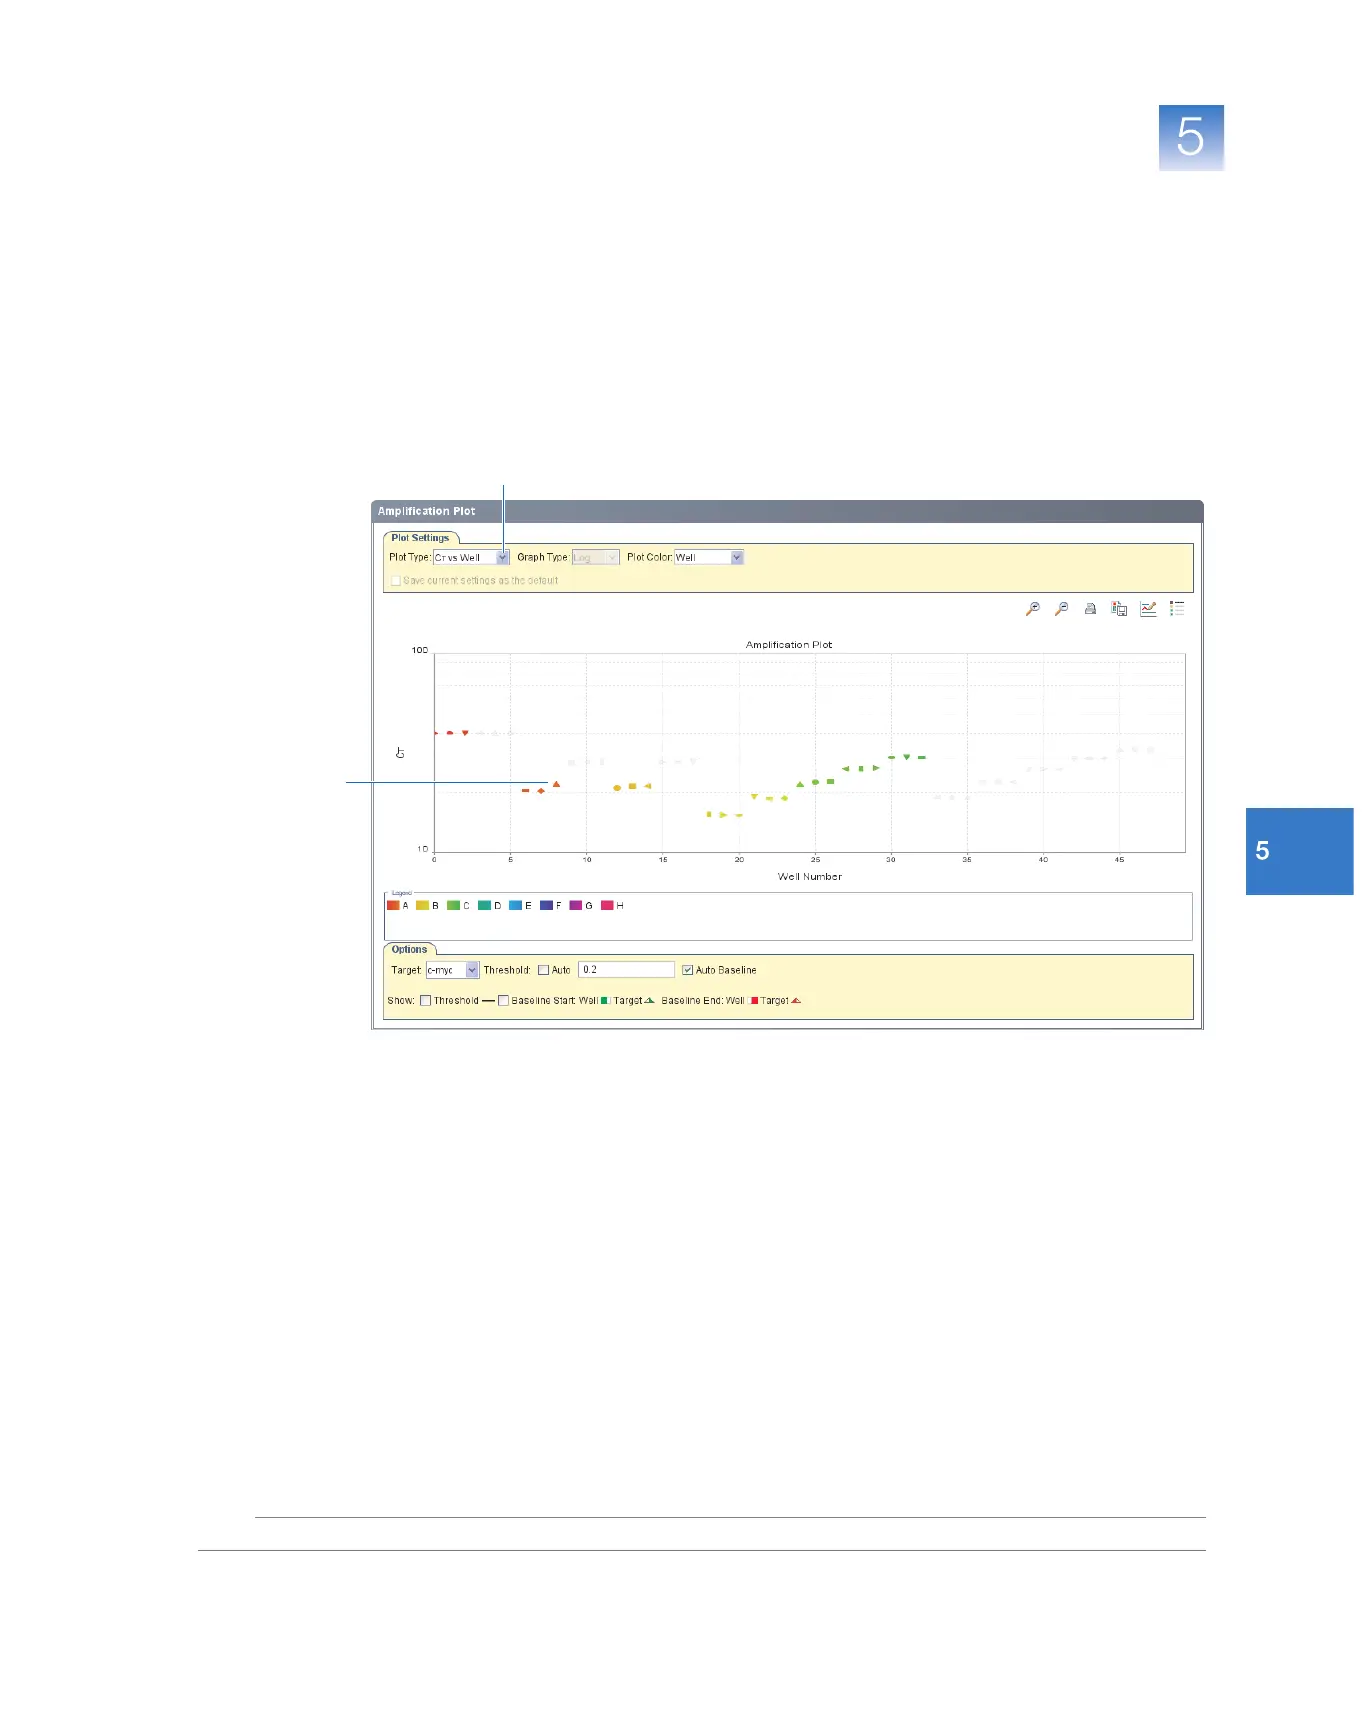
6. Locate any outliers:
a. In the Plot Type drop-down list, select C
T
vs Well.
b. Look for outliers in the amplification plot. In the example experiment, there are
no outliers for GAPDH.
7. Repeat steps 2 through 6 for the c-myc target. In the example experiment, there is
one outlier for c-myc (well A9). You omit this well in the troubleshooting section
(“Omit Wells from the Analysis” on page 105).
6a
outlier