Chapter 5 Analyze the Relative Standard Curve Experiment
View the Gene Expression Plot and Well Table
95
Applied Biosystems 7500/7500 Fast Real-Time PCR System Getting Started Guide for Relative Standard Curve
and Comparative C
T
Experiments
Notes
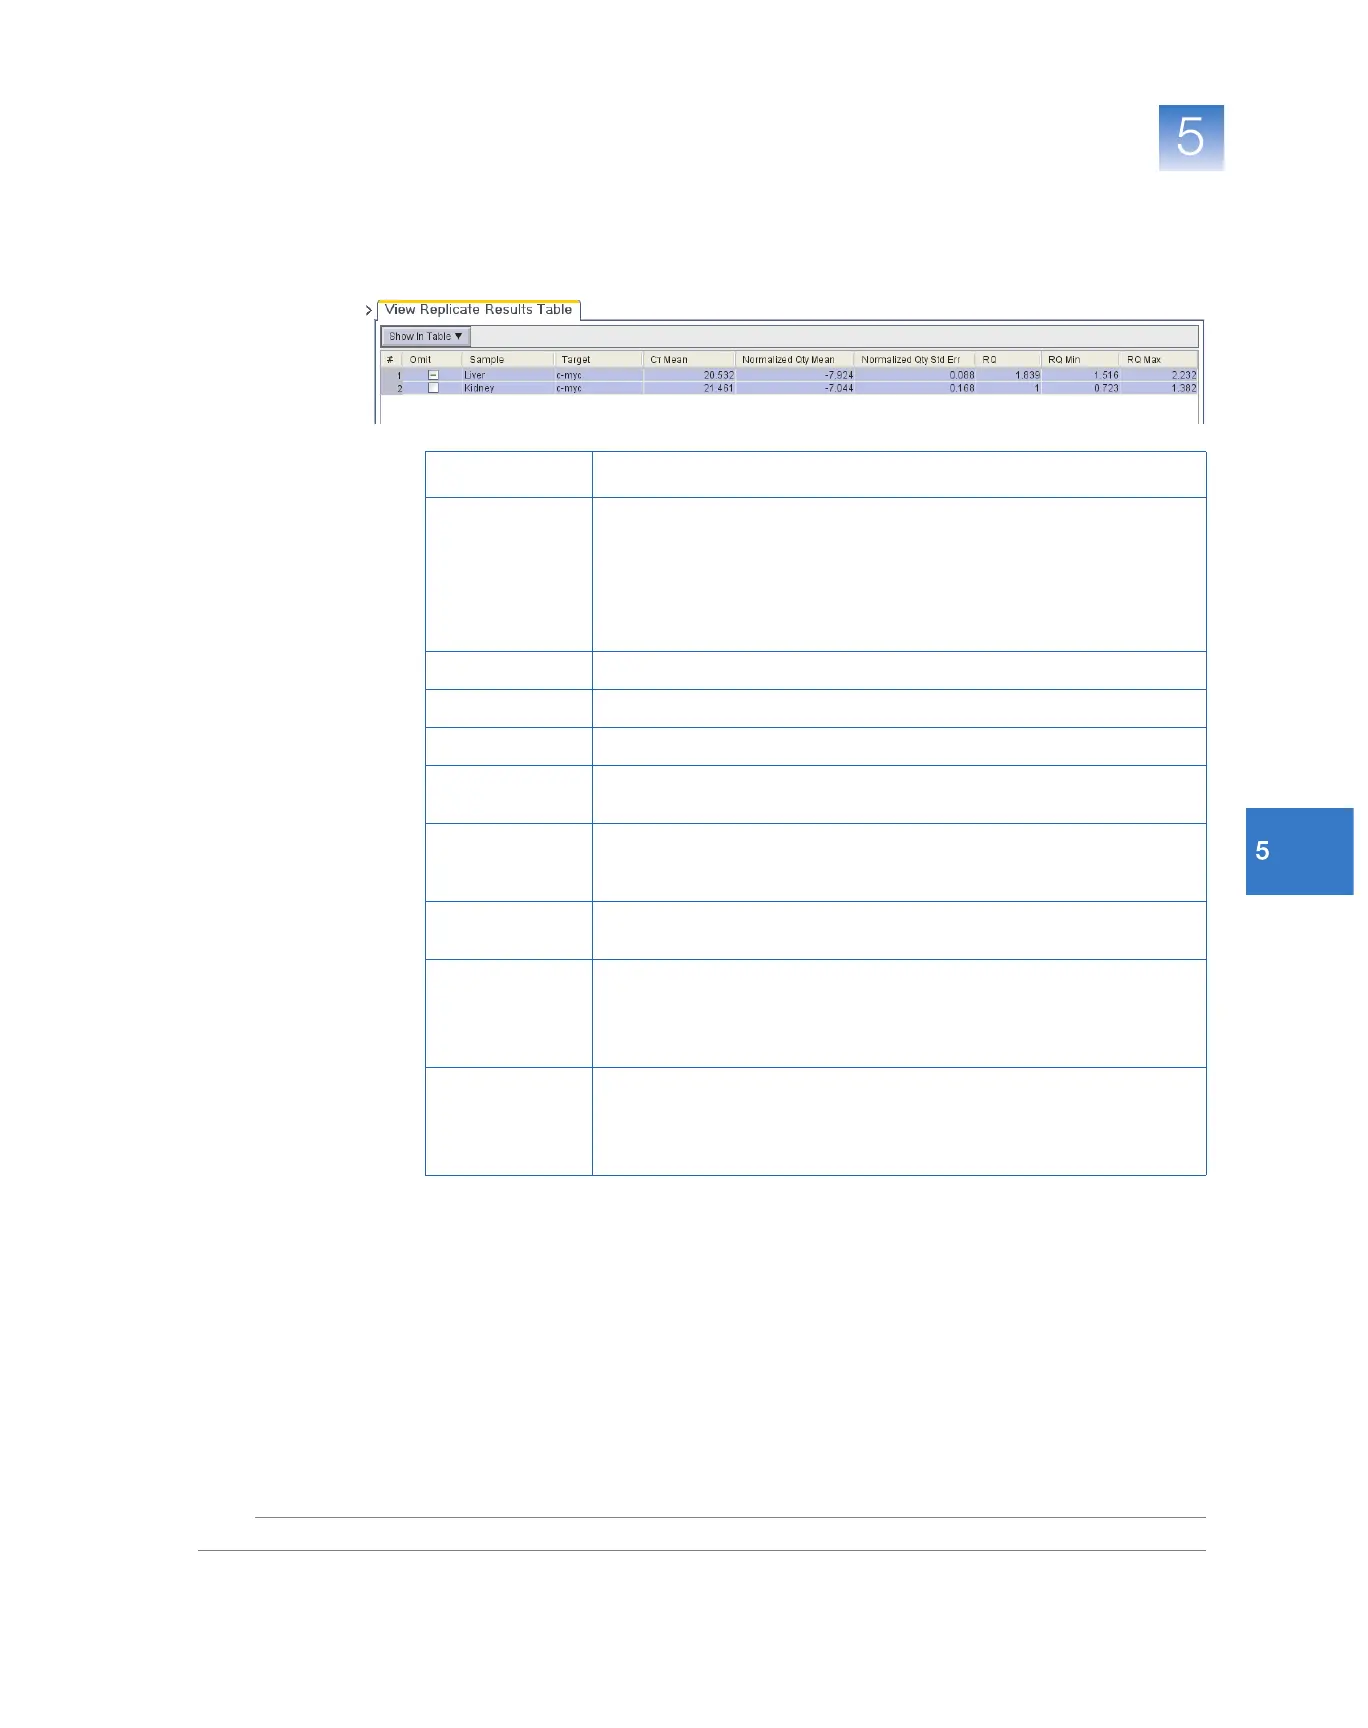
4. Click < at the top left of the View Replicate Results Table tab.
The figure below shows the replicate results table.
Column Description
Omit For all technical replicates that evaluate the associated sample/target
combination:
• A check mark (✓) indicates that all replicates have been removed from
the analysis.
•A hyphen (–) indicates that one or more replicates have been removed
from the analysis.
Sample
The sample associated with the data displayed in the row.
Targ e t
The target associated with the data displayed in the row.
C
T
Mean The arithmetic average of the technical replicate C
T
values.
Normalized Qty
Mean
The point estimate of the normalized quantities computed at the replicate
level as the geometric mean.
Normalized Qty
Std Err
The confidence interval based variability associated with the normalized
quantities computed at the replicate level as the geometric standard error
of the mean.
RQ The relative level of gene expression for the replicate group computed
using normalized quantities.
RQ Min The minimum relative level of gene expression in the test samples
computed using normalized quantities and the confidence level setting.
Note: The minimum includes the variability associated with the
endogenous control and targets in only the test samples.
RQ Max The maximum relative level of gene expression in the test samples
computed using normalized quantities and the confidence level setting.
Note: The maximum includes the variability associated with the
endogenous control and targets in only the test samples.
 Loading...