Chapter 5 Analyze the Relative Standard Curve Experiment
View the Gene Expression Plot and Well Table
Applied Biosystems 7500/7500 Fast Real-Time PCR System Getting Started Guide for Relative Standard Curve
and Comparative C
T
Experiments
96
Notes
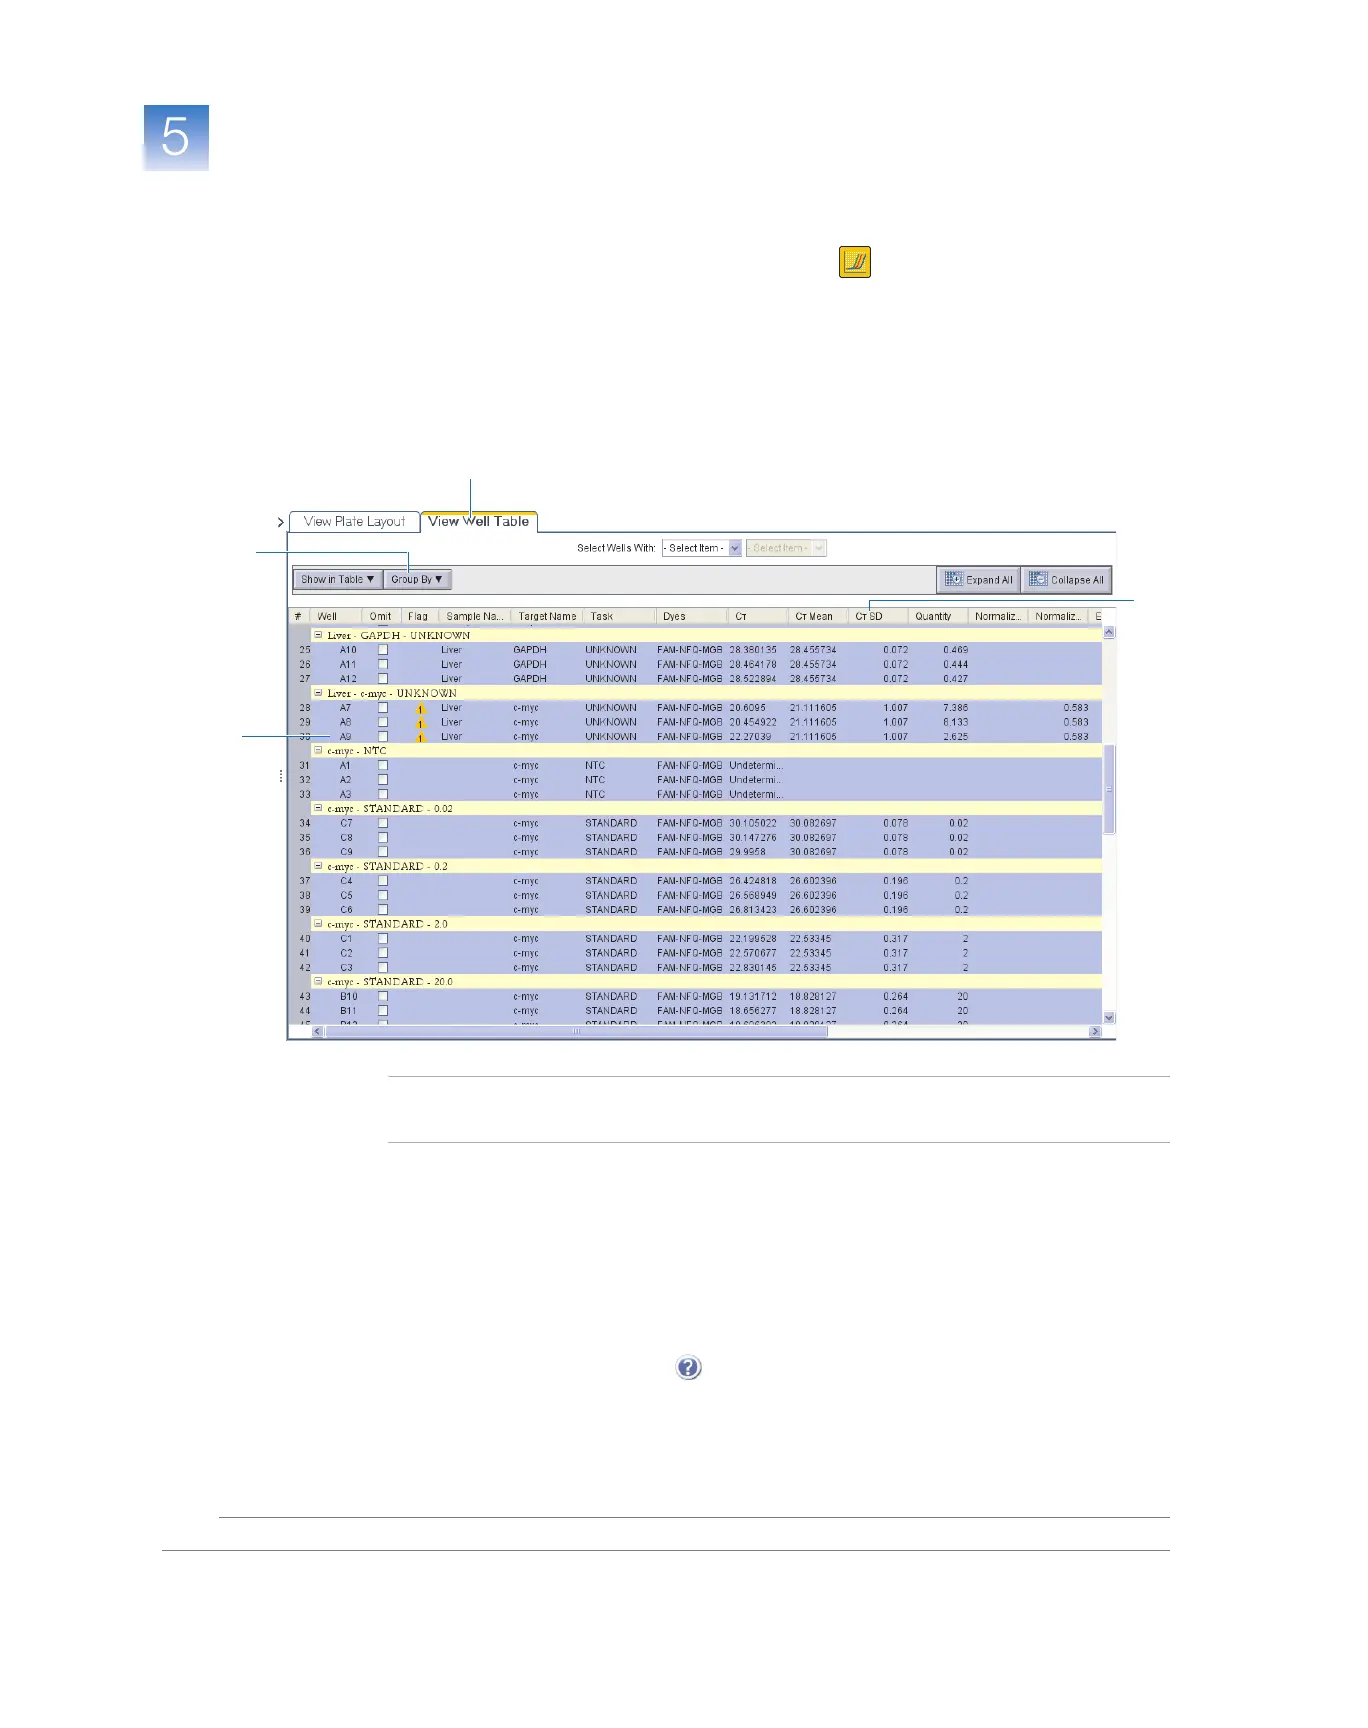
5. View the Well Table:
a. In the navigation pane, select Analysis Amplification Plot, then select
the View Well Table tab.
b. In the Group By drop-down list, select Replicate.
c. Look at the C
T
SD column to evaluate the precision of the replicate groups. In
the example experiment, there is one outlier (well A9). You will omit this well
in the troubleshooting section (“Omit Wells from the Analysis” on page 105).
Note: To show/hide columns in the Well Table, select/deselect the column name in the
Show in Table drop-down list.
Analysis
Guidelines
When you analyze your own relative standard curve experiment, look for:
• Differences in gene expression (as a fold change) relative to the reference sample.
• Standard deviation in the replicate groups (C
T
SD values). If needed, omit outliers
(“Omit Wells from the Analysis” on page 105).
For More
Information
For more information on the Gene Expression Plot screen or Well Table, open the
7500 Software Help by clicking or pressing F1.
5a
5c
5c
5b
 Loading...