Chapter 9 Analyze the Comparative C
T
Experiment
Analyze the Experiment
159
Applied Biosystems 7500/7500 Fast Real-Time PCR System Getting Started Guide for Relative Standard Curve
and Comparative C
T
Experiments
Notes
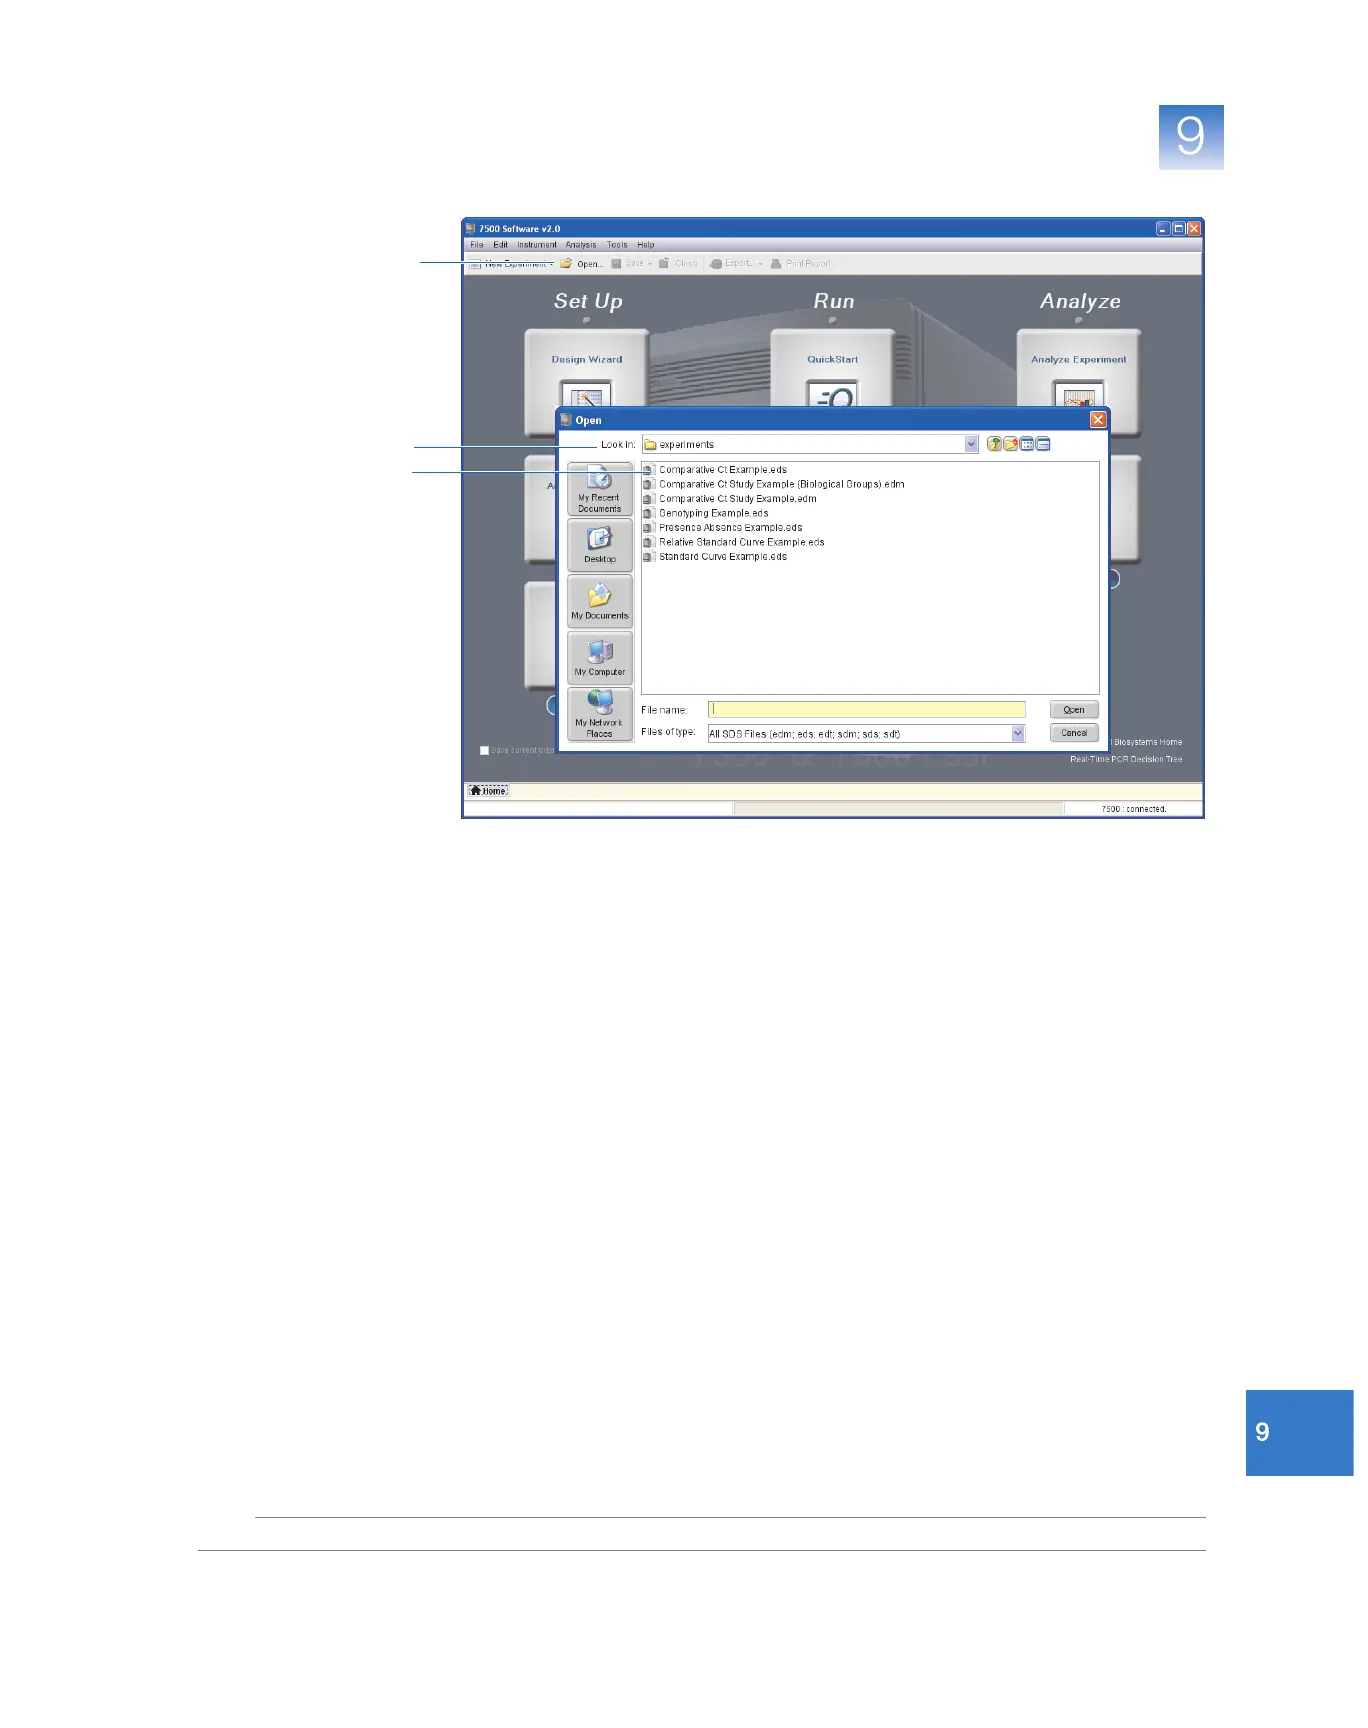
5. Click Analyze. The software analyzes the data using the default analysis settings.
6. See “Navigation Tips” on page 160 for information on navigating within the
analysis screens.
Guidelines
When you analyze your own comparative C
T
experiment:
• Immediately after a run, the 7500 software automatically analyzes the data using the
default analysis settings, then displays the Amplification Plot screen on your
computer.
• To reanalyze the data, select all the wells in the plate layout, then click Analyze.
2
4
3