Chapter 9 Analyze the Comparative C
T
Experiment
View the Amplification Plot
Applied Biosystems 7500/7500 Fast Real-Time PCR System Getting Started Guide for Relative Standard Curve
and Comparative C
T
Experiments
168
Notes
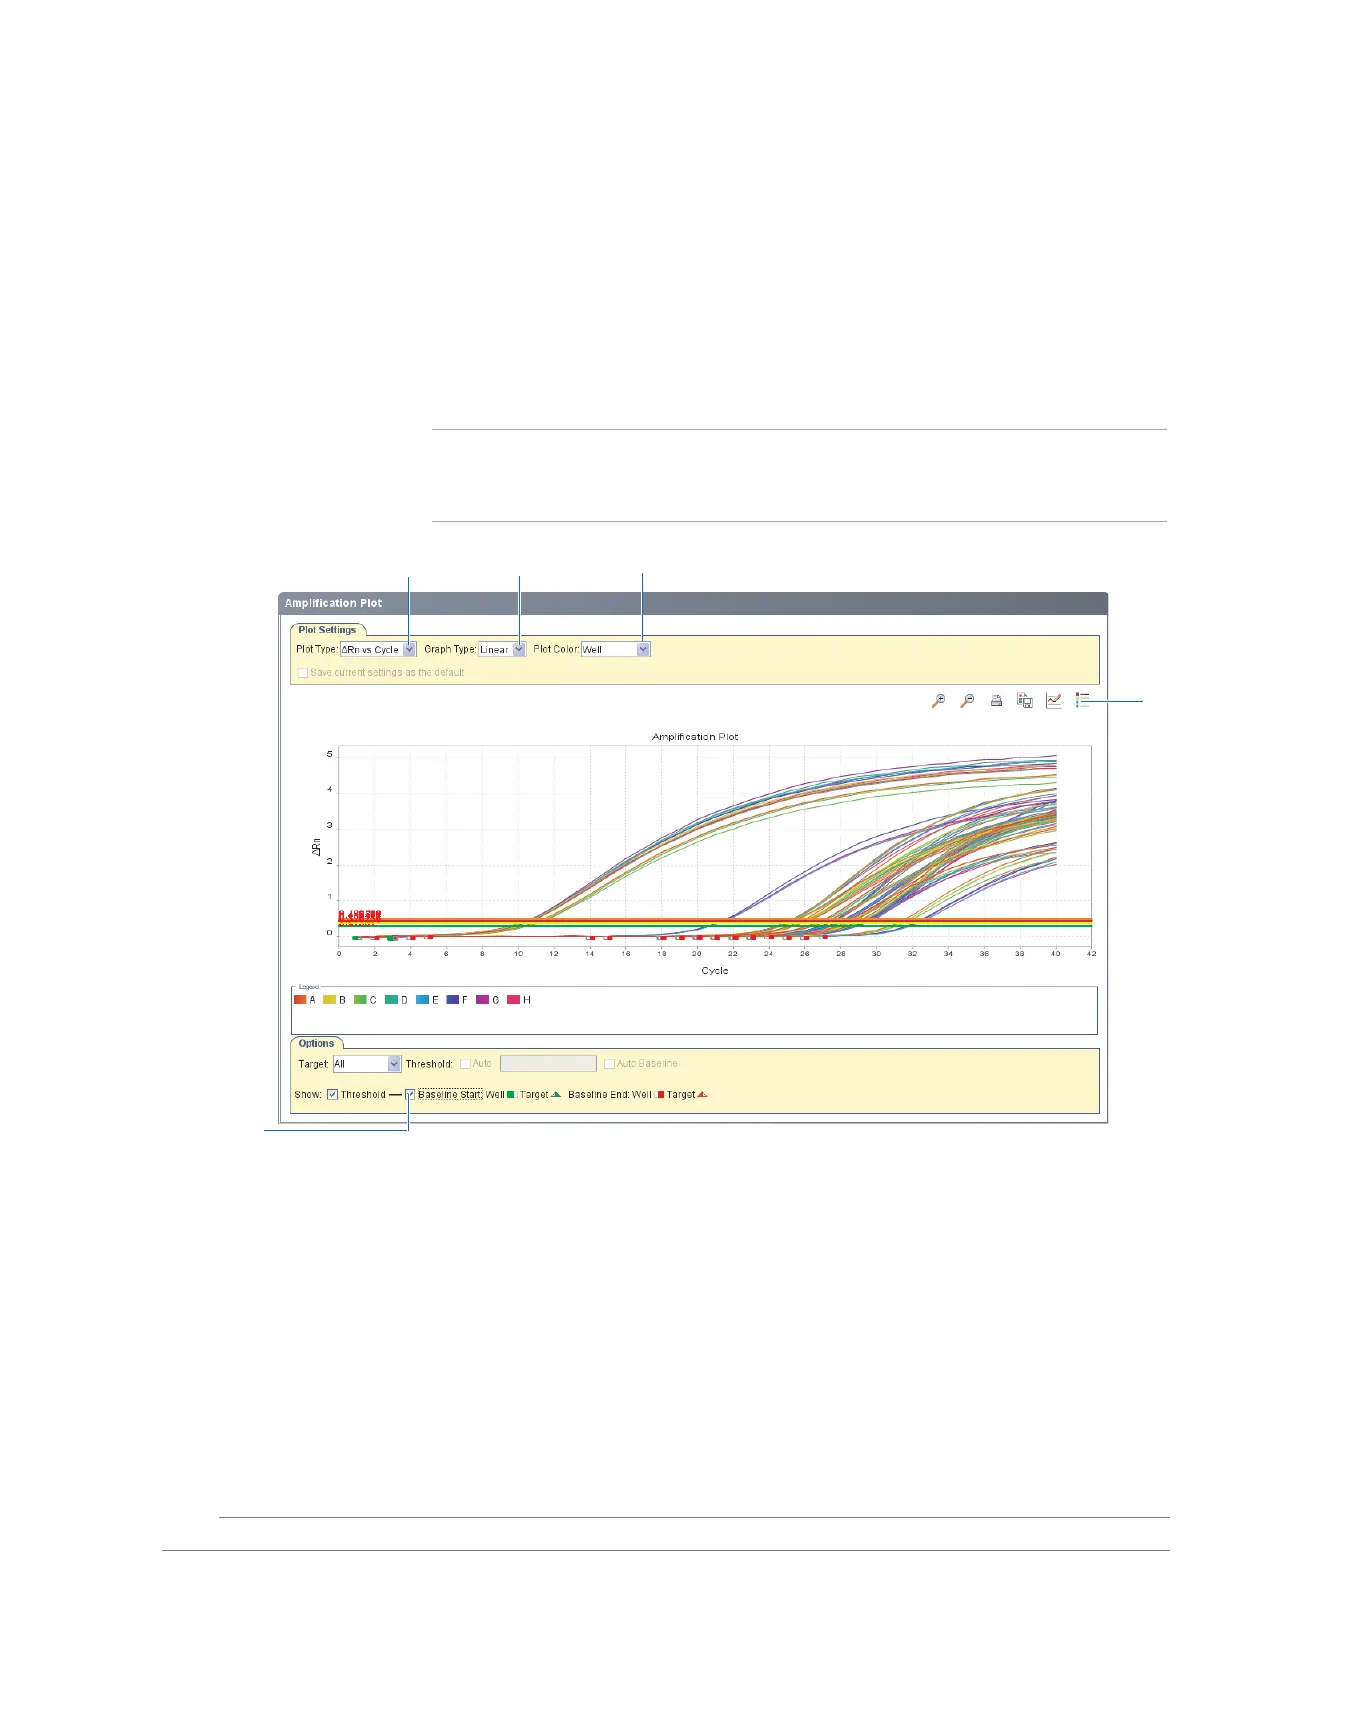
4. View the baseline values (Plot Settings tab):
a. In the Graph Type drop-down list, select Linear.
b. Select the Baseline Start check box to show the start cycle and end cycle.
c. Verify that the baseline is set correctly: The end cycle should be set a few
cycles before the cycle number where significant florescence is detected. In the
example experiment, the baseline is set correctly.
Note: By default, the Amplification Plot displays the data for all targets present in
the experiment. Consequently, the plot overlays the baseline and threshold labels for
all targets until you select an individual target from the Target drop-down list.
3c
3a
4a
3b
4b