Chapter 2 Design the Relative Standard Curve Experiment
Review the Reaction Setup
39
Applied Biosystems 7500/7500 Fast Real-Time PCR System Getting Started Guide for Relative Standard Curve
and Comparative C
T
Experiments
Notes
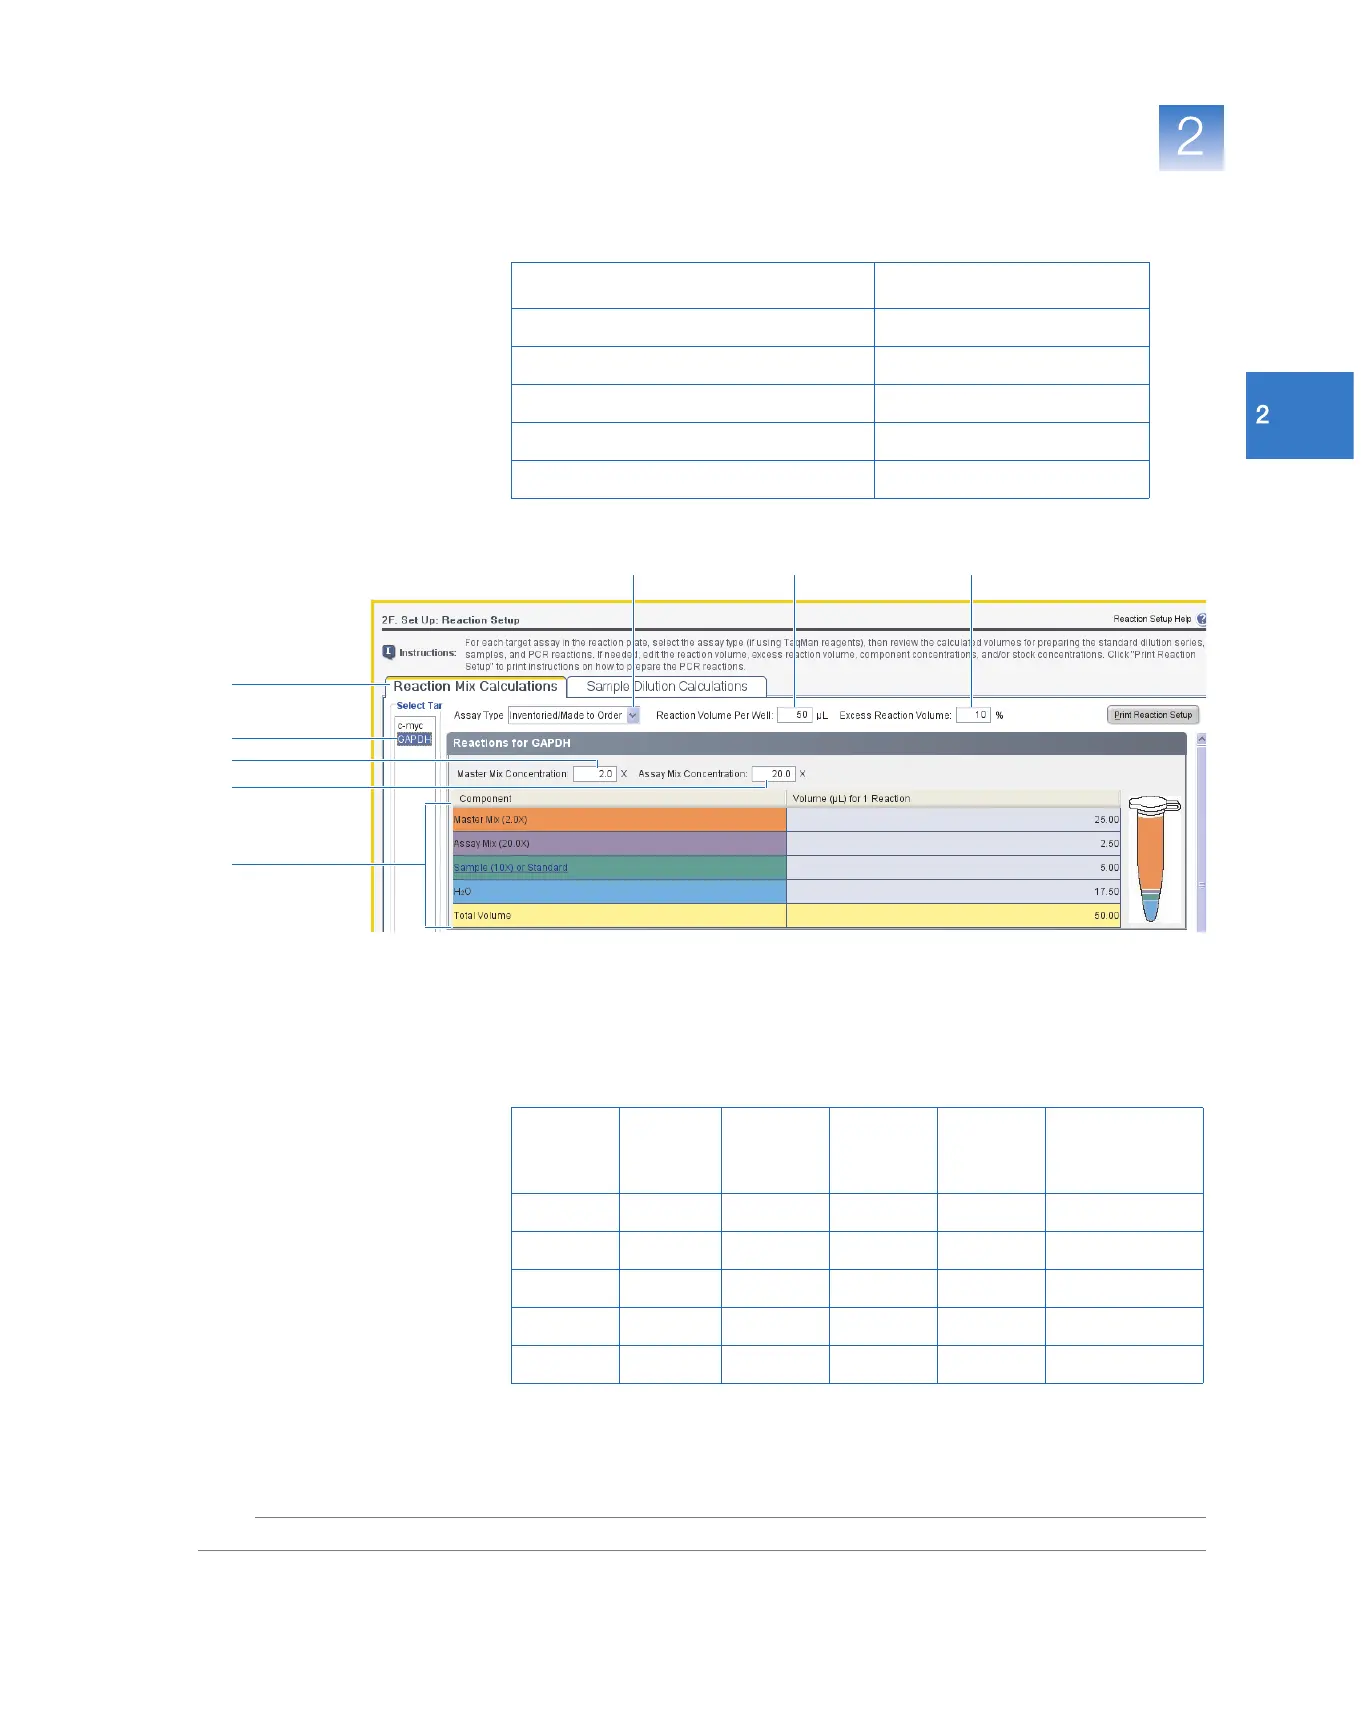
c. Review the components and calculated volumes for the PCR reactions:
7. In the Standard Dilution Series for GAPDH pane:
a. Click the Standard Concentration in Stock field, then enter 100.0.
b. In the units drop-down list, select ng per µL (default).
c. Review the calculated volumes for preparing the standard dilution series:
Component Volume (µL) for 1 Reaction
Master Mix (2.0✕) 25.0
Assay Mix (20.0✕)2.50
Sample (10✕) or Standard 5.0
‡
‡ The sample or standard volume is limited to 10% of the total reaction volume.
H2O 17.50
Total Volume 50.0
1
2
3 54
6b
6a
6c
Dilution
Point
Source
Source
Volume
(µL)
Diluent
Volume
(µL)
Tot a l
Volume
(µL)
Standard
Concentration
(ng/µL)
1 (200) Stock 8.07 12.10 20.17 40.0
2 (20) Dilution 1 2.02 18.15 20.17 4.0
3 (2) Dilution 2 2.02 18.15 20.17 0.4
4 (0.2) Dilution 3 2.02 18.15 20.17 0.04
5 (0.02) Dilution 4 2.02 18.15 20.17 0.004