A B
2
1
C
D
F
E
G
1
A B
C
2
D
E
F
3 4
25
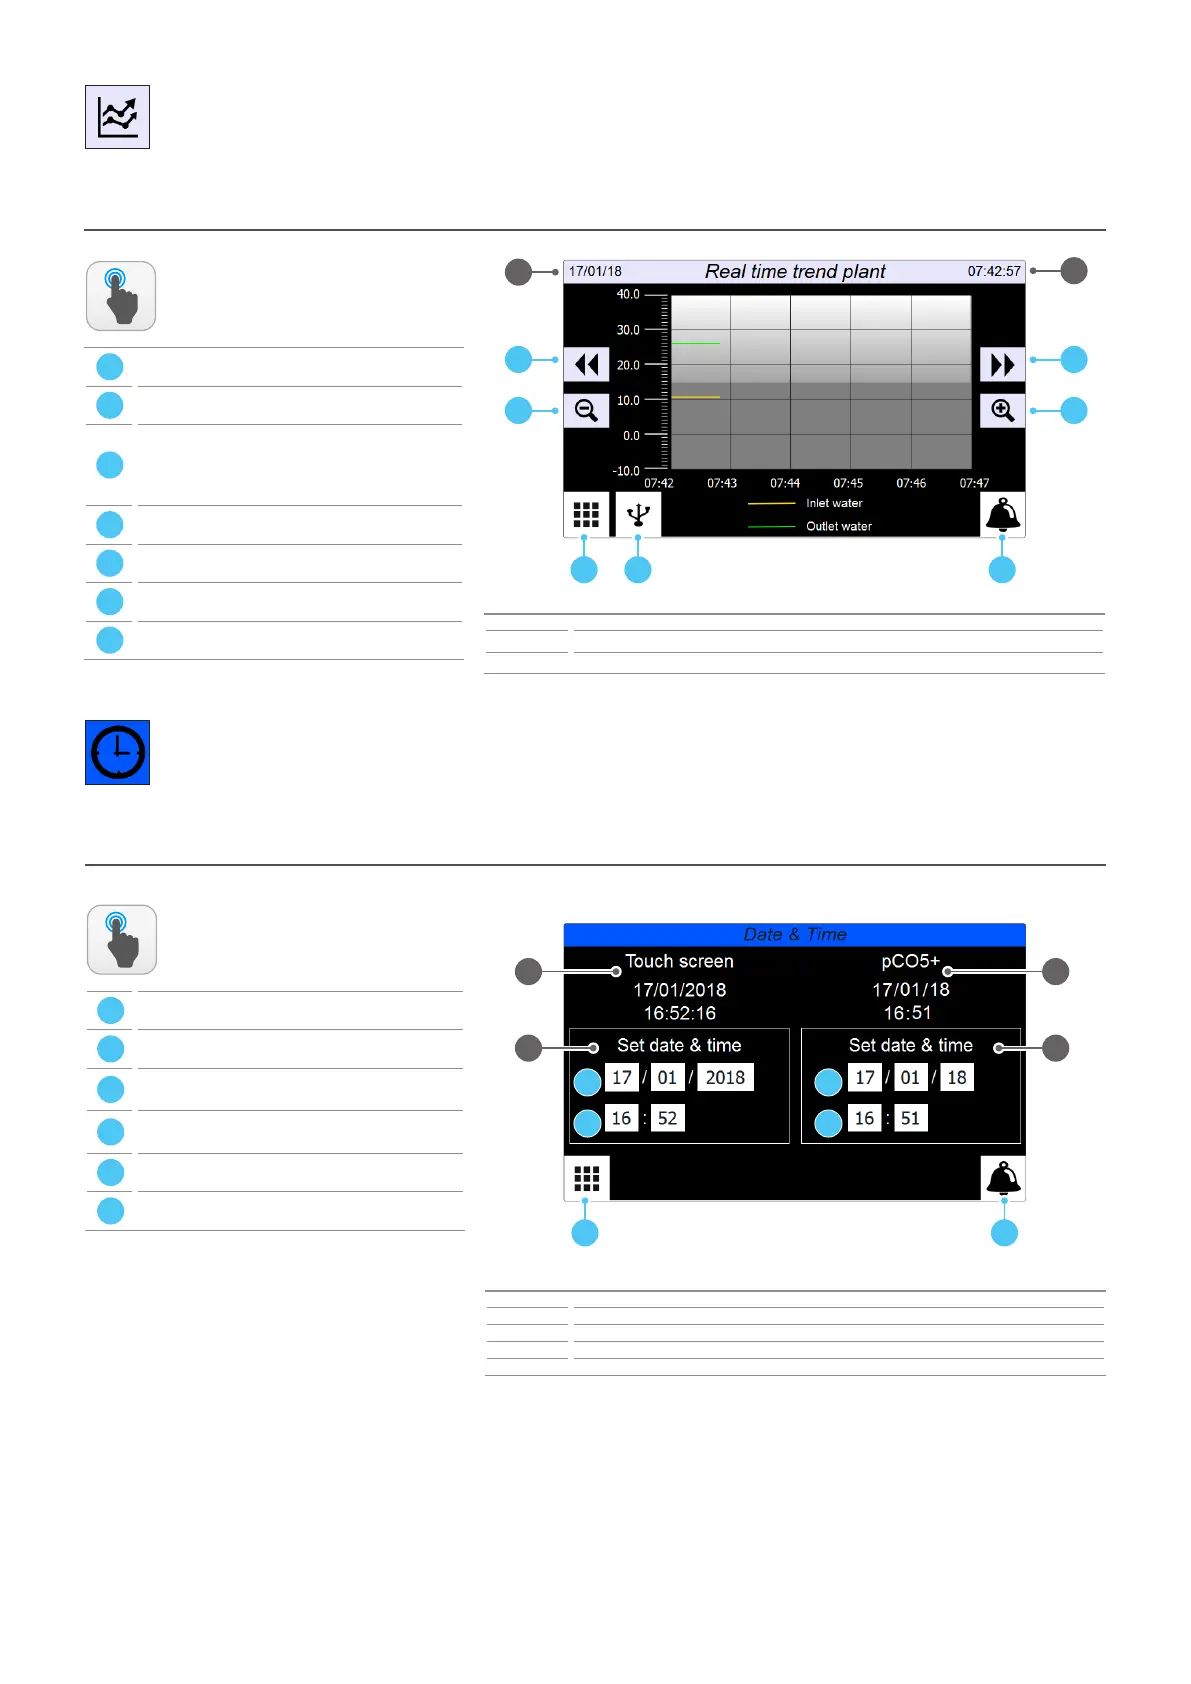
CHARTS MENU
Through the GRAPHS menu it is possible to display, in real-me, the
graph of the evaporator inlet and outlet temperature probes
Graphs menu - Graphs in real me
Index Meaning
1 Indicates system date
2 Indicates system time
ACTIONS
AVAILABLE:
A
Open the menu selecting page
B
Open the alarm menu
C
Saves the data stored in memory (4000 pairs of
evaporator inlet/outlet temperature values, sampled
every 10 seconds) on USB. This port is available behind
the touch screen
D
Scrolls the graph backward along the X axis (me)
E
Scrolls the graph forward along the X axis (me)
F
Performs a negave zoom of the graph
G
Performs a posive zoom of the graph
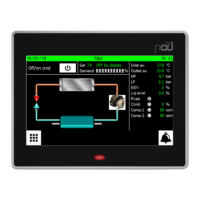
CLOCK MENU
With the CLOCK menu you can set the system mer (on the pCO5+
board) and the display mer.
CLOCK menu - Date and me sengs on the main board and on the touch display board
ACTIONS
AVAILABLE:
A
Open the menu selecng page
B
Go to alarm menu
C
Set the date (day/month/year) on the touch display
board
D
Set the me (hours:minutes) on the touch display
board
E
Set the date (day/month/year) on the pCO5+ board
F
Set the me (hours:minutes) on the pCO5+ board
Index Meaning
1 Indicates the actual date and time set on the touch display board timer
2 Indicates the actual date and time set on the pCO5+ board timer
3 Allows to adjust and/or modify the date and time on the touch display board
4 Allows to adjust and/or modify the date and time on the pCO5+ board