328 Chapter5
Programming
Generating Plots and Prints Remotely
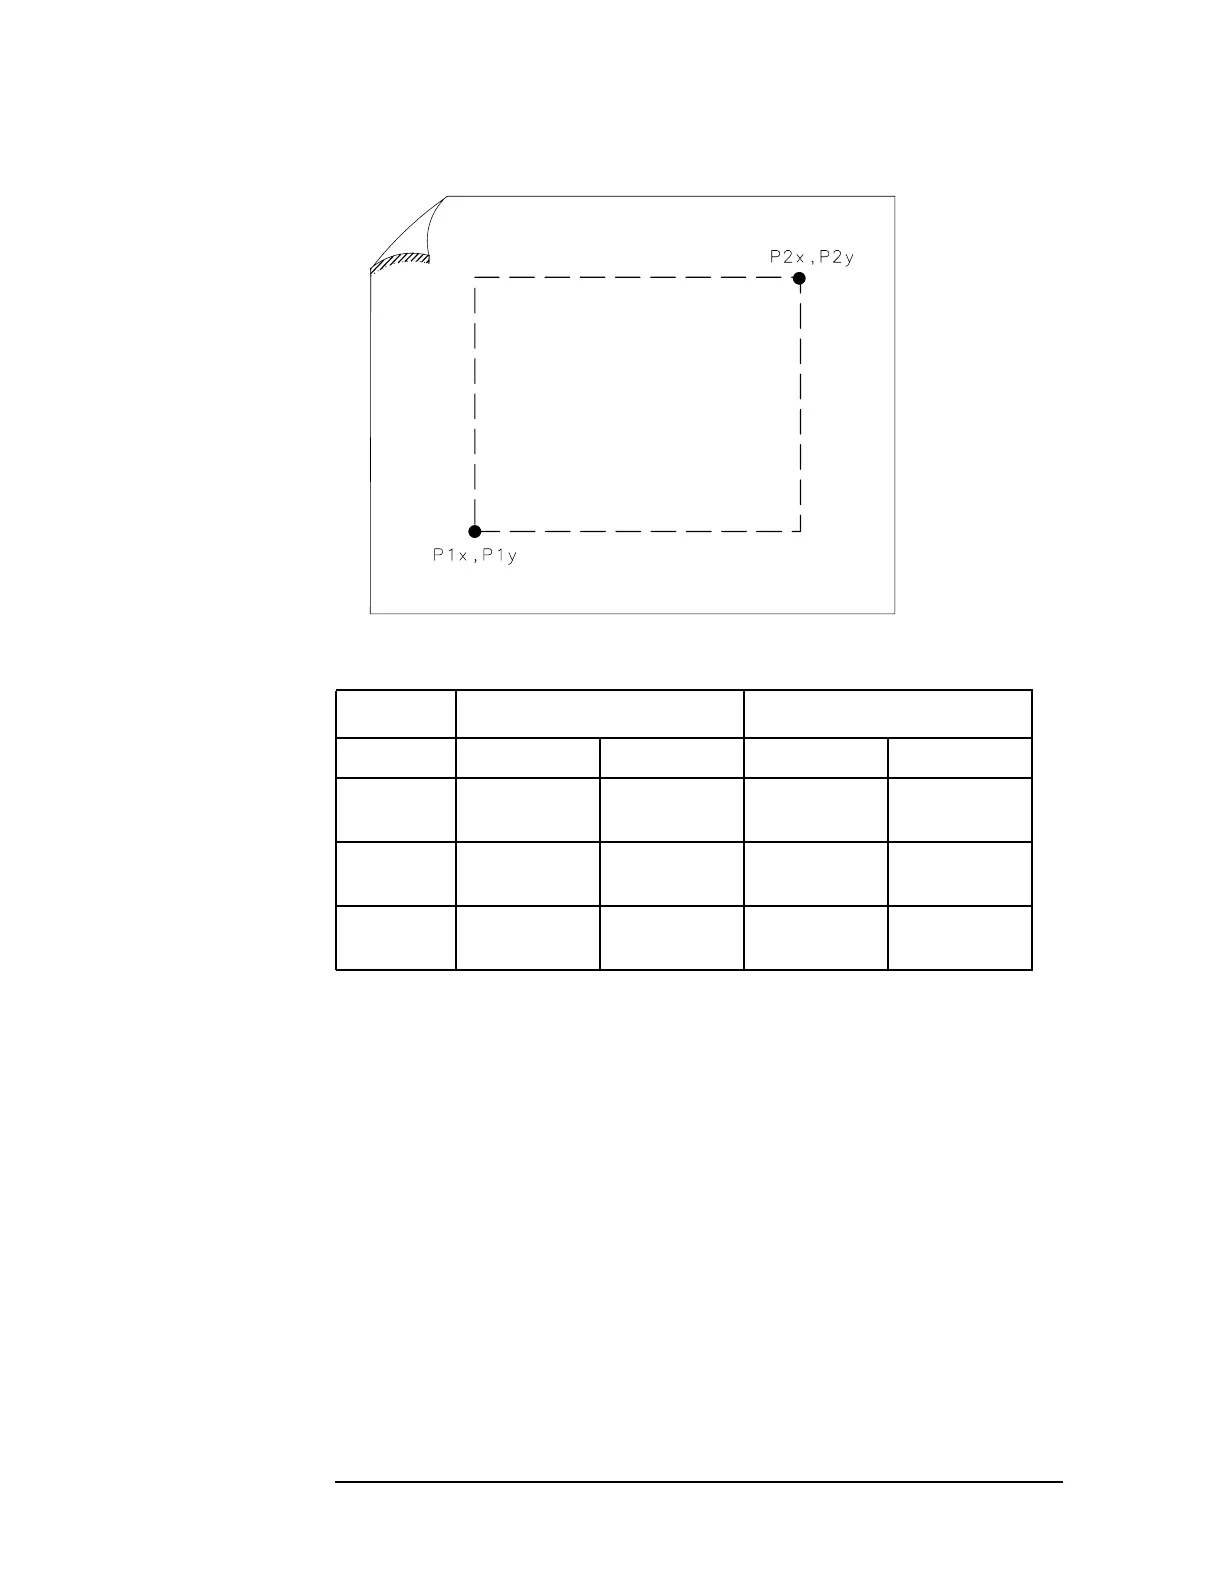
Figure 5-12 P1 and P2 Coordinates
Making a Basic Plot
To make a basic plot, choose P1 and P2 coordinates for the plot size you
desire and set the plotter to these values. The typical coordinates
shown in Table 5-1 on page 304 create a plot with approximately 1 in
margins on an 8-1/2 in by 11 in sheet of paper. (Many plotters have
default values for this size of paper.) You can enter coordinates in a
program directly, or query the plotter for the values. The latter method
is used in the example program below. To generate a plot, connect the
plotter via GPIB to the computer and execute Example 1.
E
XAMPLE 1
10 OUTPUT 705;"OP;"
20 ENTER 705; P1x,P1y,P2x,P2y
30 OUTPUT 718;"PLOT ";P1x;",";P1y;",";P2x;",";P2y;";"
40 SEND 7;UNL LISTEN 5 TALK 18 DATA
50 END
Table 5-3 Scaling Points for Various Plotters
Typical Scaling Points Plotting Range
Plotter P1x,P1y P2x,P2y X-Axis Y-Axis
Agilent
7440
250,279 10250,7479 0 to 10900 0 to 7650
Agilent
7470A
250,279 10250,7479 0 to 10900 0 to 7650
Agilent
7475A
250,596 10250,7796 0 to 10365 0 to 7962