160 Chapter2
Making Measurements
Example 13: Making Pulsed RF Measurements
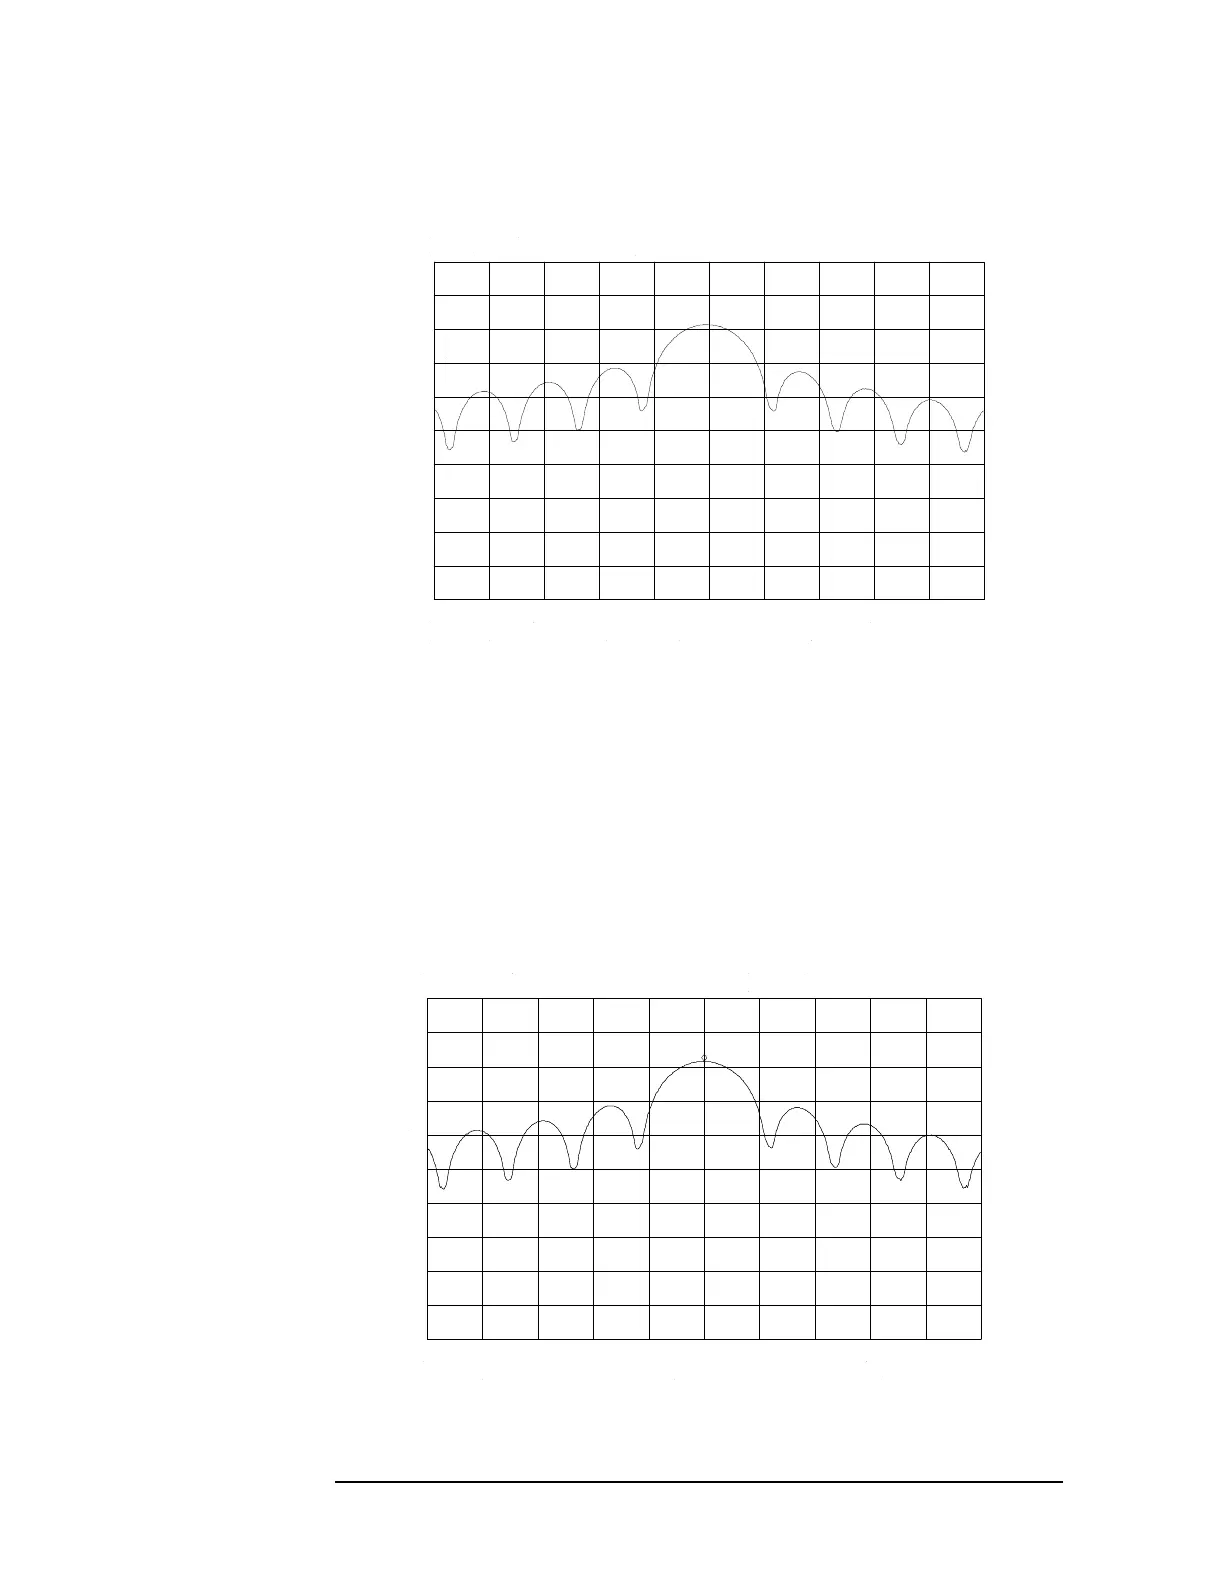
Figure 2-84 Trace Displayed as a Solid Line
Center Frequency, Sidelobe Ratio, and Pulse Width
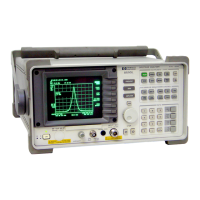
1. For a pulsed RF signal, the center frequency is at the center of the
main lobe (see Figure 2-85). To identify this frequency, simply use
the spectrum analyzer peak search function. The marker also reads
the main lobe amplitude.
Figure 2-85 Center Frequency at Center of Main Lobe

 Loading...


