Chapter 2 65
Making Measurements
Example 3: Modulation
• Gradually change the modulation frequency (or change the
amplitude of the modulation signal) and observe the changes in the
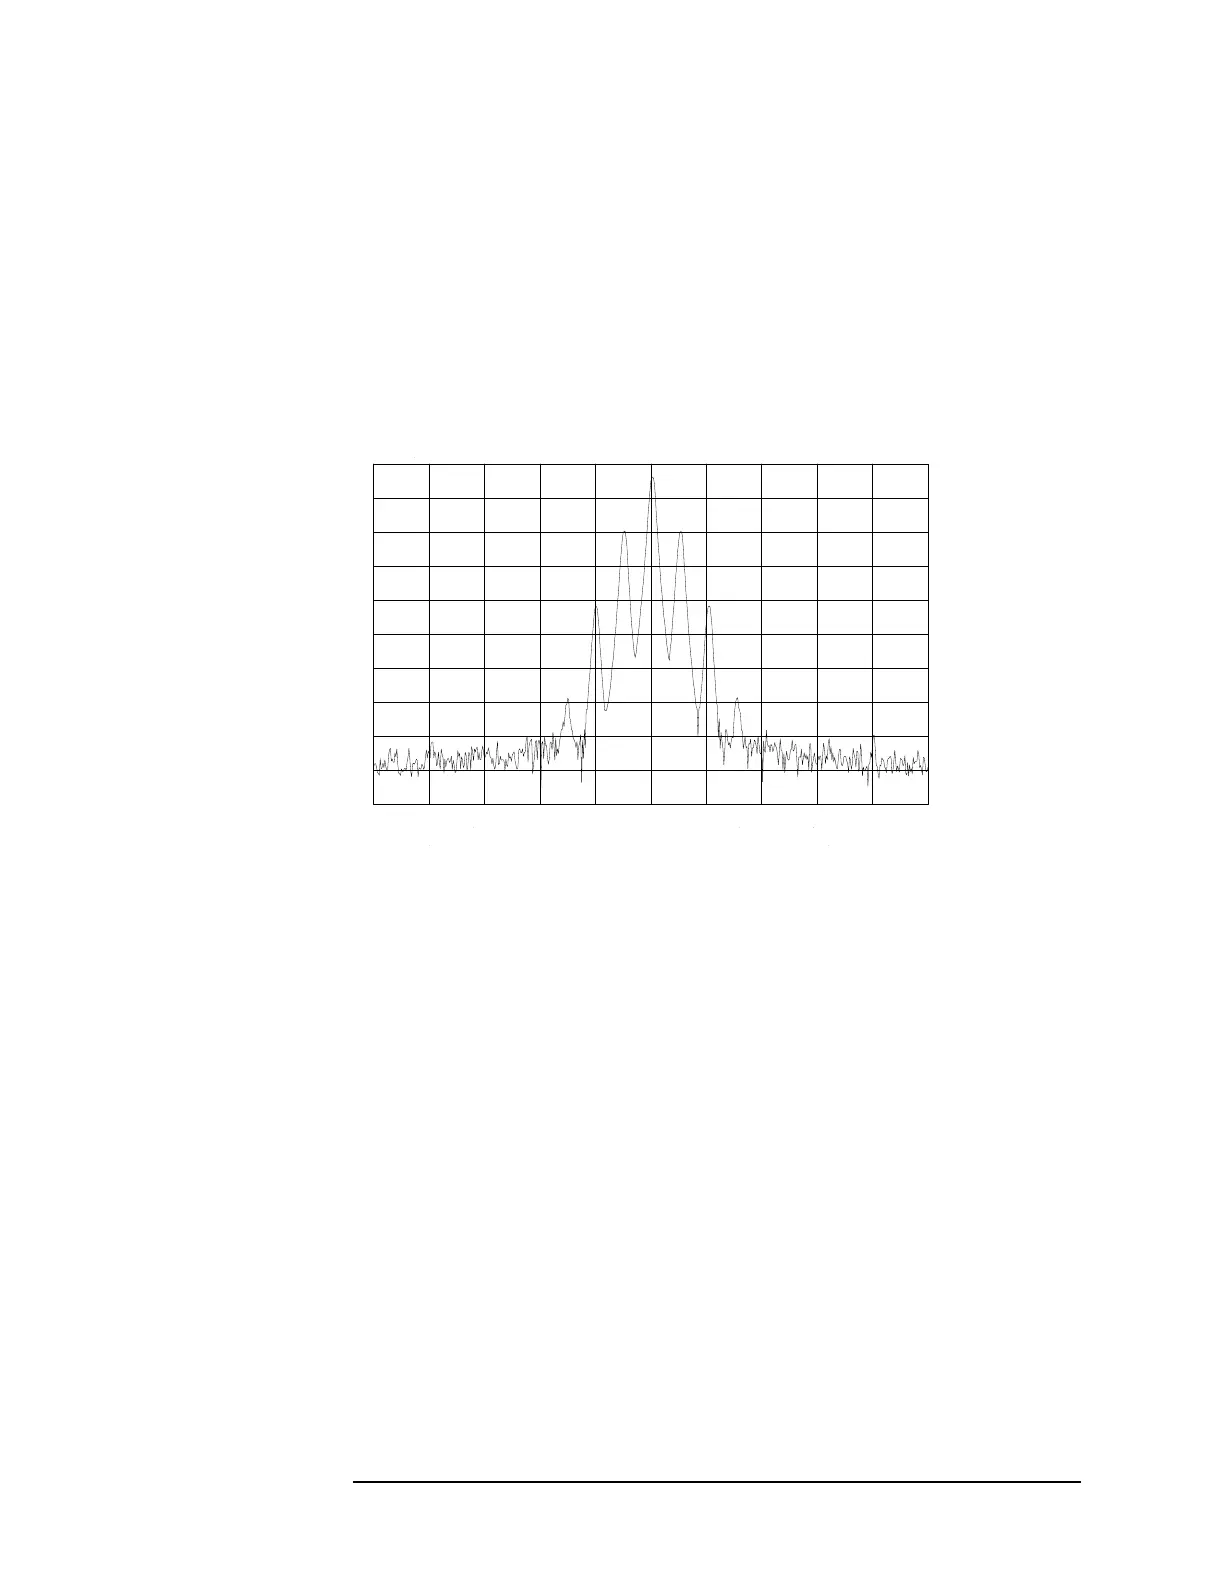
displayed nulls. Figure 2-12 illustrates a frequency-modulated
signal with a small modulation index (modulation index of about 0.2)
as it appears on a spectrum analyzer. Figure 2-13 on page 66 and
Figure 2-14 on page 66 illustrate larger modulation index values. In
the first figure the null is at the carrier. In the second figure the null
is at the first sideband.
Figure 2-12 A Frequency-Modulated Signal