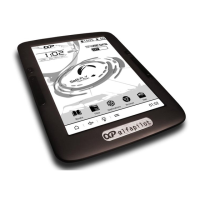
Graph of Vario
When modifying the bars or values of configuration, in the graph we will see the changes dynamically.
1. Start Frequency, indicates the frequency at which our Vario begins to sound. Horizontally
corresponds to the Hz scale, and Vertically corresponds to the scale in m/s.
2. End Frequency, indicates the frequency at which our Vario ending to sound. Horizontally
corresponds to the Hz scale, and Vertically corresponds to the scale in m/s.
3. Actual value, this point is defined by the value of the Test Bar, and serves as a reference.
4. Frequency graph, when modifying the values and bars, we will see in a visual way how the
frequency is increase or decreased will be.
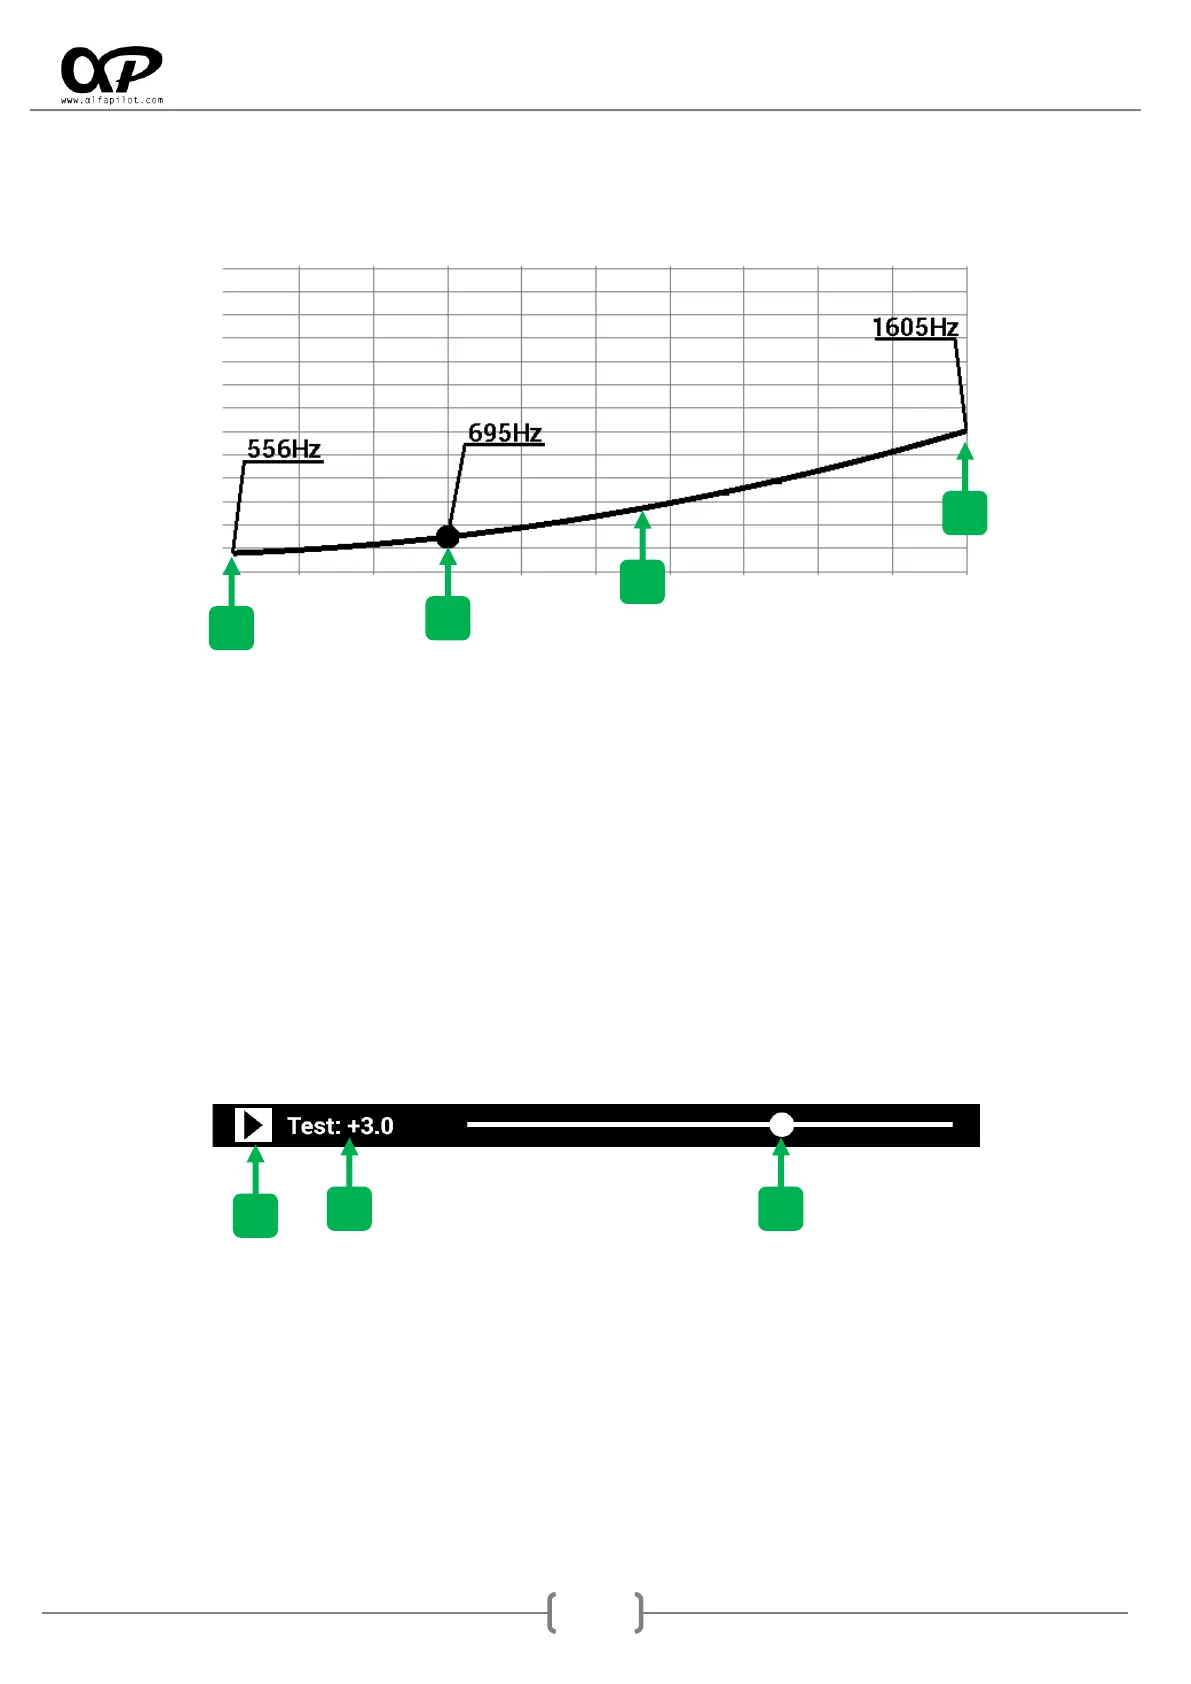
Vario Test
1. Test icon, pressing it will start or stop sounding our vario. It helps us to simulate the vario as if we
were flying, and it will help us to choose better the values and adjustments that we like. When it is
sounding, the sound of the vario will be updated dynamically as we change the values and settings.
2. Vario Value, the current value in m/s at which our Vario is playing.
3. Control Bar, when moving this bar, we will simulate the vertical speed of our Vario, we will see the
current value in both the "Vario Value", and in the graph of the various "Actual Value".