25
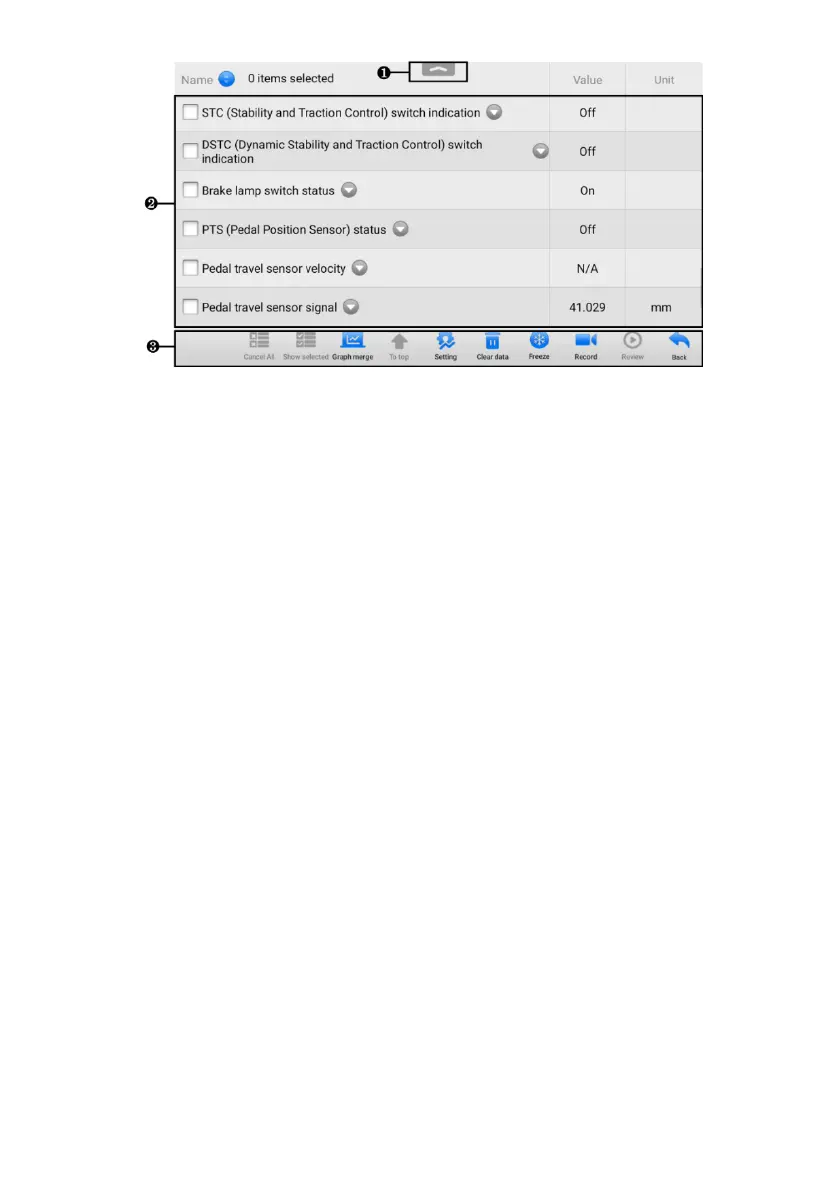
Figure 4-9 Live Data Screen
1. Diagnostics Toolbar Buttons — tap the drop-down button at the top center of the
screen and the toolbar buttons will display. See Table 4-2 Diagnostics Toolbar
Buttons for details.
2. Main Section
⚫ Name Column — displays the parameter names.
a) Check Box — tap the check box on the left side of the parameter name to
make item selection. Tap the check box again to deselect the item.
b) Drop-down Button — tap the drop-down button on the right side of the
parameter name to open a sub menu, providing data display mode options.
⚫ Value Column — displays the values of the parameter items.
⚫ Unit Column — displays the unit for the parameters. (Tap the Settings button
on the diagnostic toolbar and select a required mode. See Unit for more
information.)
3. Function Buttons — There are many function buttons on the Live Data screen.
Detailed descriptions of these buttons are described in the following subsections.
A. Display Mode
There are four types of display modes available for data viewing, allowing you to
view various types of parameters in the mode best suited to represent the data.
Tap the drop-down button on the right of a parameter to open a submenu. A total of
7 buttons will be displayed: The 4 buttons to the left represent different data display
modes, plus an Information button (active when additional information is available),
a Unit Change button (for switching the unit of displayed data), and a Trigger button
(tap to open the Trigger Settings screen).