28
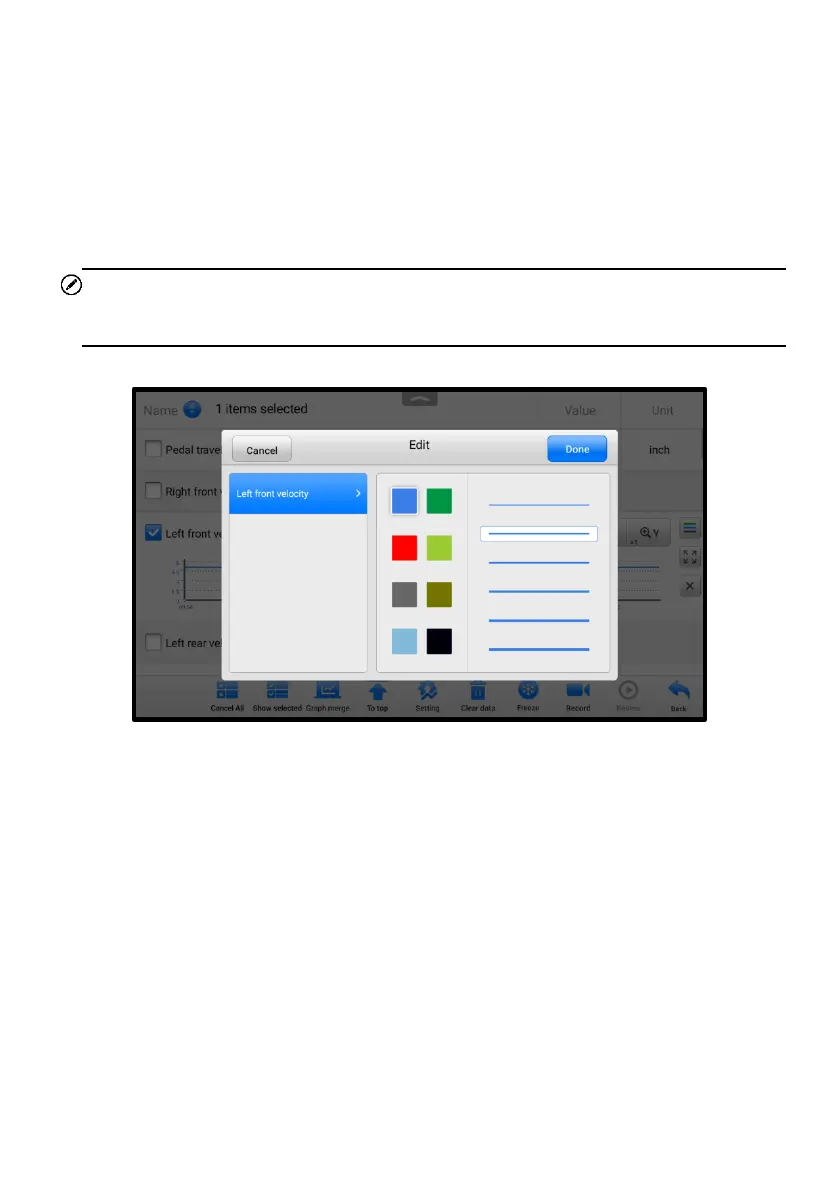
➢ To edit the waveform color and line thickness in a data graph
1. Select parameters to display in Waveform Graph mode.
2. Tap the Edit Button, and an edit window will appear.
3. The parameter is selected automatically in the left column.
4. Select a color from the second column.
5. Select a line thickness from the right column.
6. Tap Done to save the settings and exit, or tap Cancel to exit without saving.
NOTE
In full screen mode, you can edit the waveform color and line thickness by tapping the
Edit button on the top-right side of the screen.
Figure 4-12 Waveform Edit Screen
◆ Digital Gauge Mode — displays the parameters in the form of a digital gauge
graph.
B. Trigger Settings
On the Trigger Settings screen, you can set a standard range by filling in a minimum
value and a maximum value. When exceeding this range, the trigger function will be
executed and the tablet will automatically record and save the generated data. You
can review the saved live data by tapping the Review button at the bottom of the
screen.
Tap the drop-down button on the right side of a parameter to open a submenu. The
Trigger button is the last one in the submenu. Tap to display the Trigger Settings
screen.
 Loading...