Camus ProtoNode Start-up Guide
Page 48 of 87
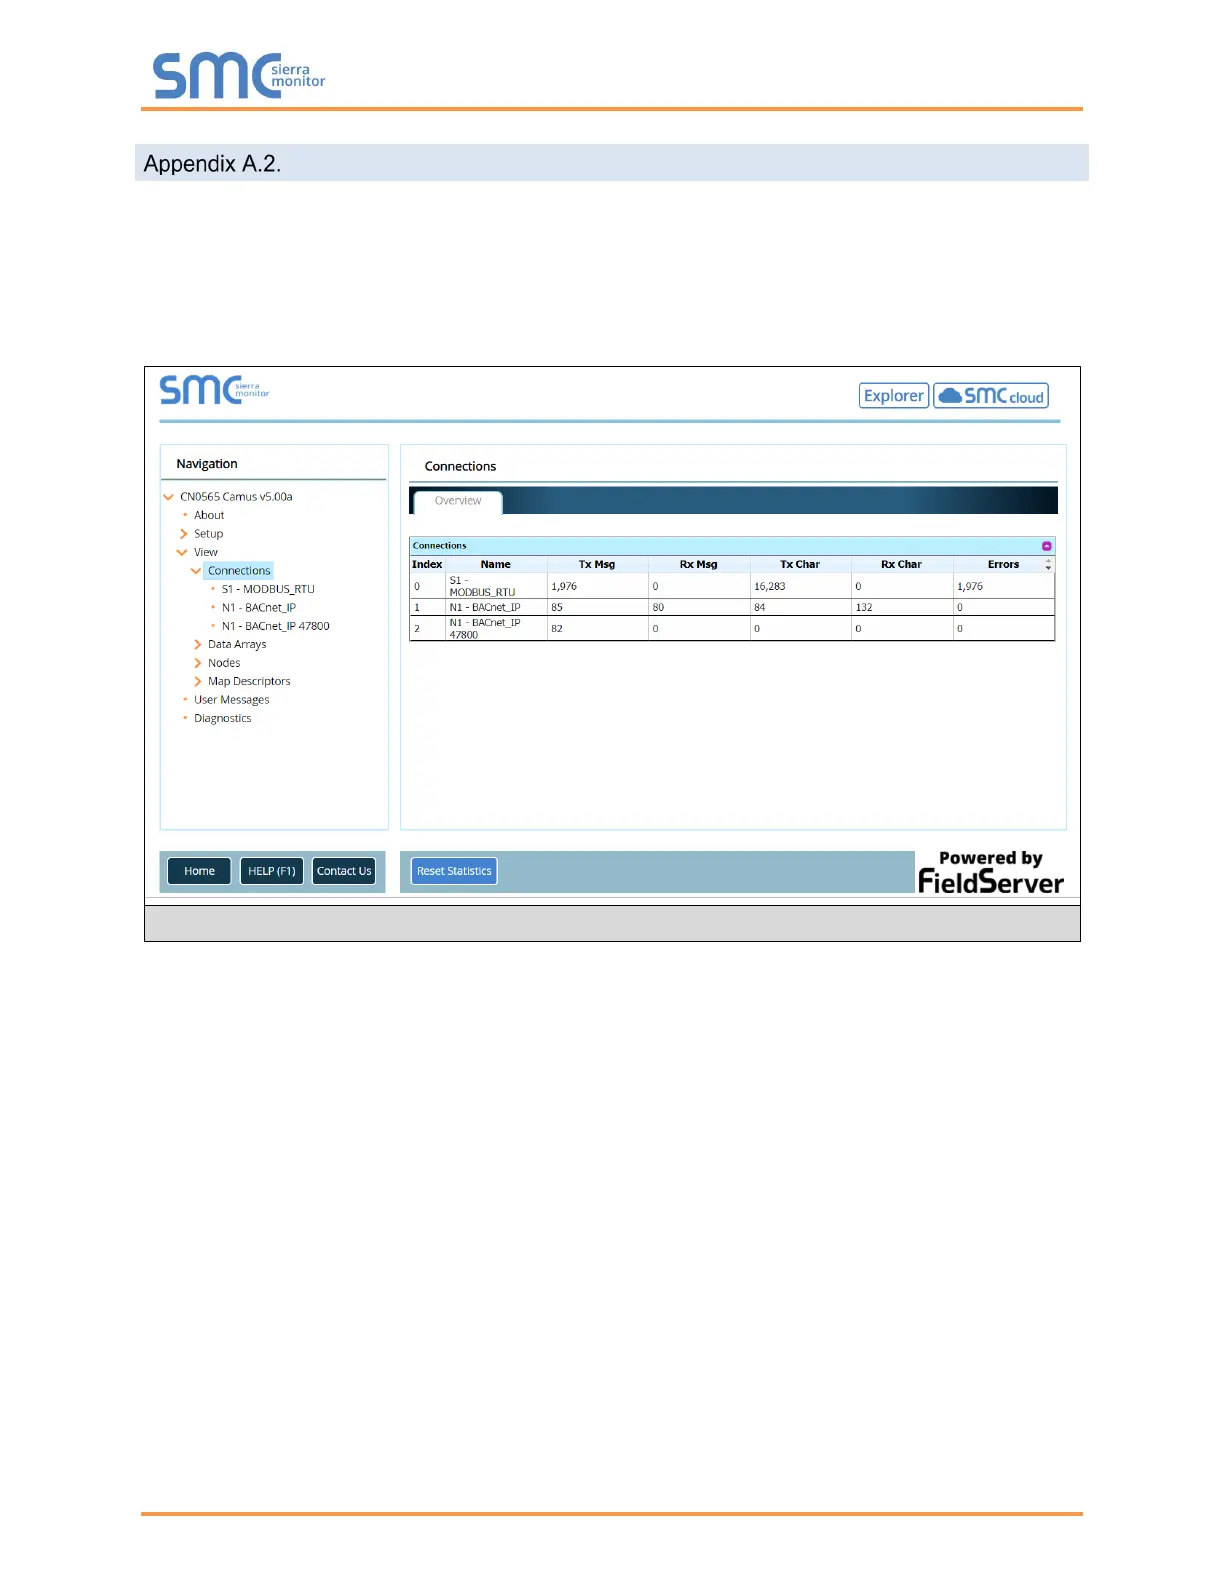
Viewing Diagnostic Information
• Type the IP Address of the ProtoNode into the web browser or use the FieldServer Toolbox to
connect to the ProtoNode.
• Click on Diagnostics and Debugging Button, then click on view, and then on connections.
• If there are any errors showing on the Connection page, refer to Appendix A.3 for the relevant
wiring and settings.
Figure 41: Error Messages Screen
 Loading...