-
-
-
- 48 -
-
-
-
Time in response to each group of trend data is displayed at the leftmost list with date in bracket.
Marked event corresponds to marking time. Trend data of each parameter is divided into 8 groups.
HR, PVCS
ST1, ST2
RR
TEMP1, TEMP2, TEMPD
SPO
2
, PR
IBP1(S/D/M), IBP2(S/D/M)
CO
2
, INS, AwRR
NIBP (S/M/D)
NIBP trend data presents different specificity.
A
certain NIBP measuring time is displayed below the
TEST
AT
item, as well as the measurement value. For more than one measurement in one time, it can
display only one group, and mark a "*" on the MORE to indicate two and above measurement results.
To
To
To
To
choose
choose
choose
choose trend
trend
trend
trend table
table
table
table of
of
of
of different
different
different
different resolution
resolution
resolution
resolution
Pick the leftmost item and change the time interval of trend data.
To
To
To
To
view
view
view
view other
other
other
other trend
trend
trend
trend data
data
data
data :
:
:
:
When " " appears on the upper part of the screen, pick UP-DOWN button and turn the knob
clockwise to view later trend data . When " " appears on the lower part of the screen, pick the same
item and turn the knob counterclockwise to view earlier trend data.
To
To
To
To
obtain
obtain
obtain
obtain trend
trend
trend
trend data
data
data
data of
of
of
of different
different
different
different parameter
parameter
parameter
parameter
Pick L-RIGHT to select one from the 8 groups of parameters.
A
">" by the rightmost item indicates
following page available. And "<" by the leftmost item indicated previous page available.
To
To
To
To
print
print
print
print out
out
out
out the
the
the
the trend
trend
trend
trend data
data
data
data
Pick REC to print out the trend data of current displayed parameter.
Mark
Mark
Mark
Mark event
event
event
event
If an event is marked A, B, C, or D, the corresponding event type will display on the axis time of the
trend table.
Operation
Operation
Operation
Operation example
example
example
example
To
view a NIBP trend table:
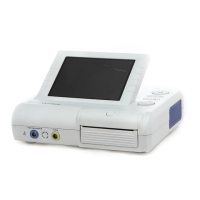
Pick MENU button on the front panel of the monitor to access “ MAIN MENU ” .
Pick TREND TABLE.
Pick L-RIGHT and switch to NIBP by turning the knob.
Pick the first item from the left and select requested time interval.
Pick UP-DOWN and turn the knob to view NIBP trend data of different time.
For printout of trend table, pick REC to start report printing of all trend data including NIBP of this
time span.
Pick EXIT to return to MAIN MENU .
7.3
7.3
7.3
7.3 NIBP
NIBP
NIBP
NIBP Recall
Recall
Recall
Recall
The monitor can review the latest 400 NIBP measurement data.
Pick NIBP RECALL in the MAIN MENU to invoke the result and time of the latest 9 measurements, as
shown in the figure below .