CSV Data File Layout 73
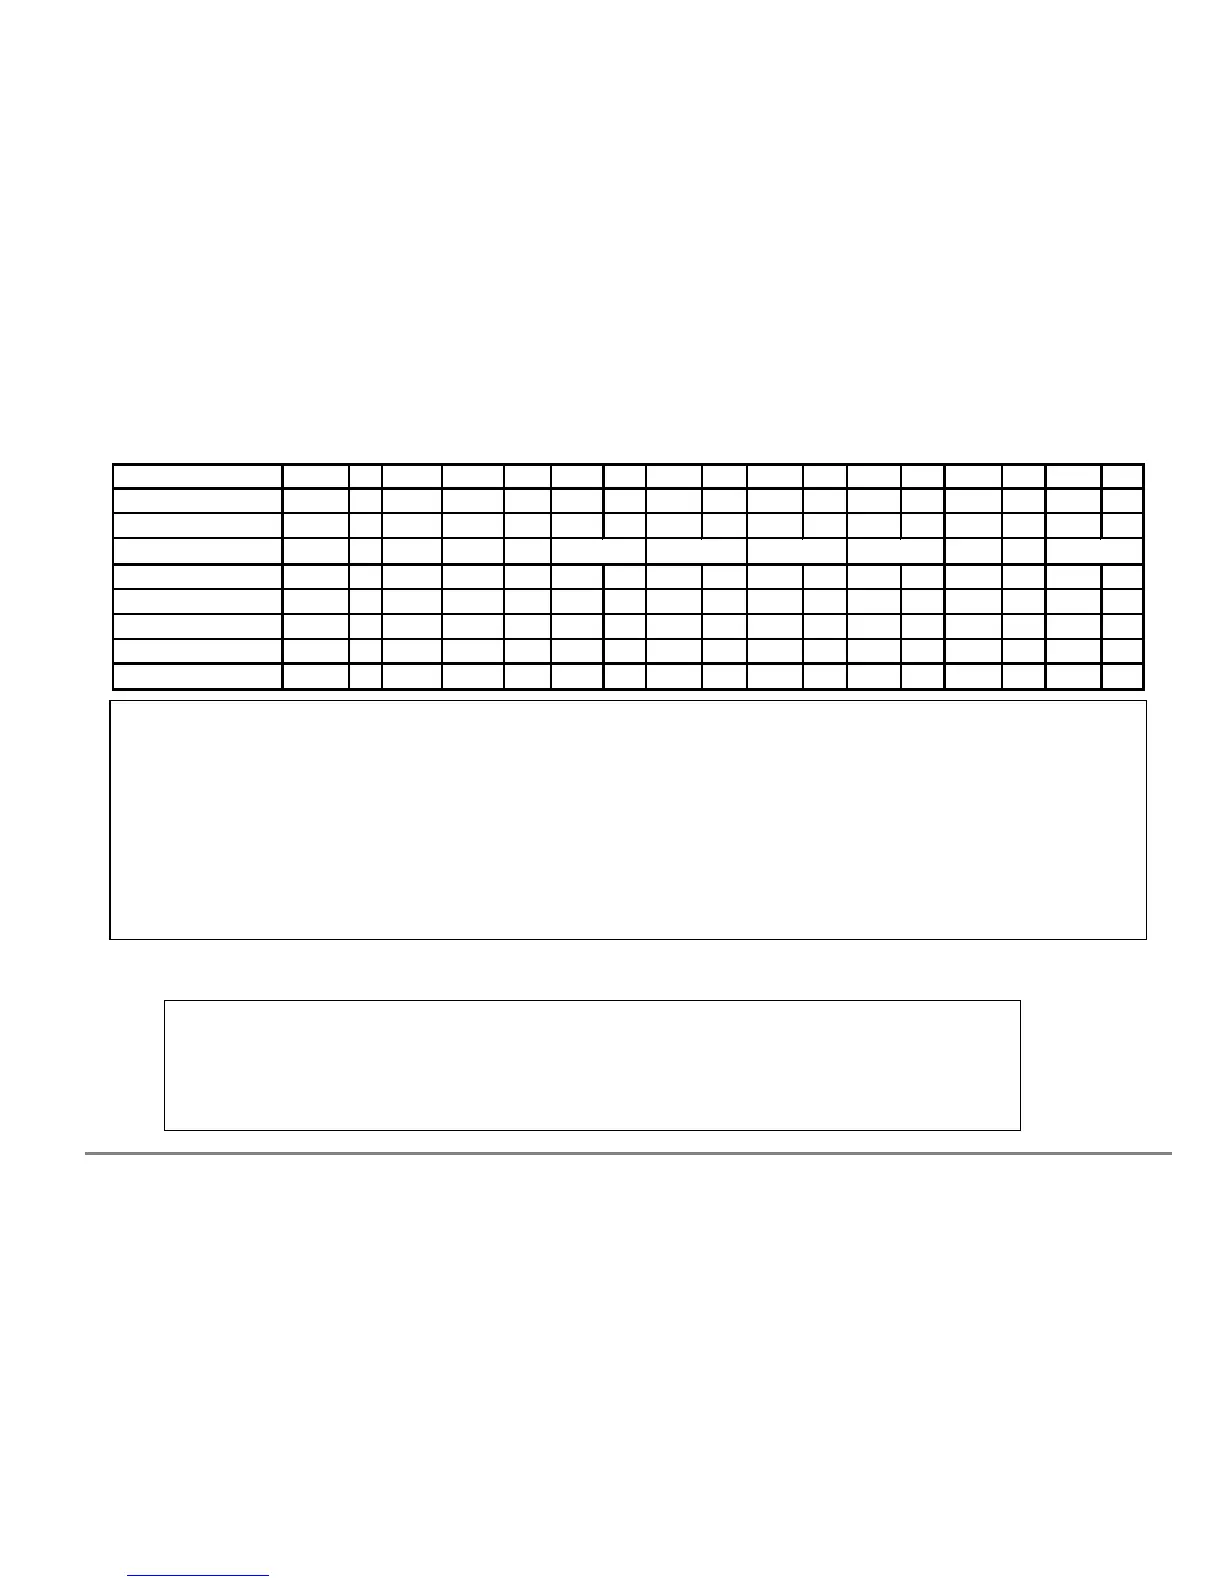
Device >> PR2
Root Depth >> 700
Sensor Depth (mm) >> 100 200 300 400 600 1000
Soil >> Organic Organic Organic Organic Organic Organic
Time Sample Plot Device
Error mV Error mV Error mV Error mV Error mV Error mV Error
28/03/2001 16:48:44 1 A 0 31.1 311.1 311.1 311.1 311.1 311.1 311.1
28/03/2001 16:49:44 2 B 10 31.1 311.1 311.1 311.1 311.1 311.1 311.1
28/03/2001 16:50:44 3 C 100 31.1 311.1 311.1 311.1 311.1 311.1 311.1
28/03/2001 16:51:44 4 D 255 31.1 311.1 311.1 311.1 311.1 311.1 311.1
Label A.Sample A.Device A.VWC A.mV
A.VWC A.mV A.VWC A.mV A.VWC A.mV
Channel 100 100 200 200 300
300 400 400
Sensor Type PR1 PR1 PR1 PR1 PR1 PR1 PR1 PR1 PR1 PR1
Units
m3.m-3 mV m3.m-3 mV m3.m-3 mV m3.m-3 mV
7-Jan-00 19:53:08 1 0 0.507 397 0.973
451 0.494 333 0.004 26
7-Jan-00 19:53:20 2 0 0.507 397 0.973 451 0.493 332 0.004 26
7-Jan-00 19:53:30 3 0 0.505 396 0.971 451 0.493 332
0.003 26
Layout of Profile Probe Readings
Note: these readings are preceded by the Linearisation tables - as in Data File Part 1, above.
Above: typical layout if you open the CSV data file in Microsoft Excel (File, Open command)
(These readings are preceded by the Linearisation tables - as in Data File Part 1, above.)
Below: typical layout if you import the .CSV data file using the Dataset Import Wizard (File, Import Datasets command).
Note the changes in how the various HH2 Options have been displayed.
The Plot ID, in this example- "A" is added to the labels in the first row.
The Sample and Device labels still have their own columns.
The sensor depth is displayed in the row called "Channel".
The header row "Soil " has been dropped
See also: "Dataset Import Wizard Notes for HH2 Users"