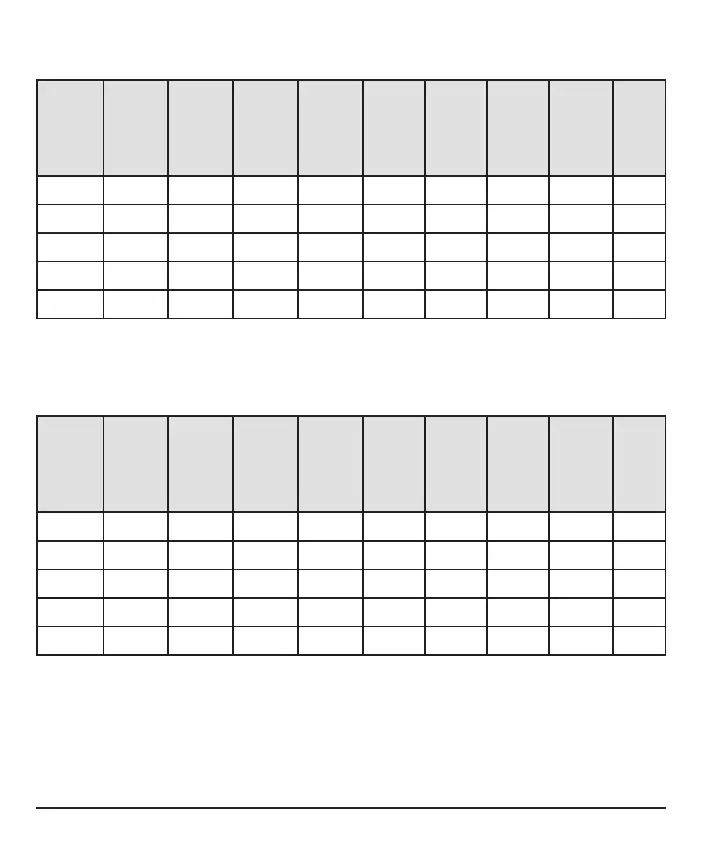
Table 1-B. G7 accuracy to comparator method within CGM glucose ranges
(adults; n=308)
CGM
glucose
range
1
(mg/dL)
Number
of paired
CGM-YSI
Percent
within
15
mg/dL
YSI
Percent
within
20
mg/dL
YSI
Percent
within
40
mg/dL
YSI
Percent
within
15% YSI
Percent
within
20% YSI
Percent
within
40% YSI
Mean
bias
(mg/dL)
MARD
(%)
<54 1,140 79.7 88.9 98.9 --- --- --- -9.3 16.0
54-69 3,729 92.8 96.1 99.3 --- --- --- -2.3 9.1
70-180 18,379 --- --- --- 83.6 91.9 99.0 0.4 8.9
181-250 6,055 --- --- --- 89.3 95.2 99.8 -2.7 7.5
>250 9,890 --- --- --- 94.5 98.2 100.0 -2.3 6.0
1
CGM readings are within 40-400 mg/dL, inclusive.
Table 1-C. G7 accuracy to comparator method within CGM glucose ranges
(pediatrics*; n=122)
CGM
glucose
range
1
(mg/dL)
Number
of paired
CGM-YSI
Percent
within
15
mg/dL
YSI
Percent
within
20
mg/dL
YSI
Percent
within
40
mg/dL
YSI
Percent
within
15% YSI
Percent
within
20% YSI
Percent
within
40% YSI
Mean
bias
(mg/dL)
MARD
(%)
<54 162 52.5 71.0 92.0 --- --- --- -17.7 24.1
54-69 719 89.8 94.0 97.4 --- --- --- -4.7 9.0
70-180 3,996 --- --- --- 85.1 92.6 99.6 -0.7 8.3
181-250 1,316 --- --- --- 87.9 95.9 99.9 -3.2 7.5
>250 1,875 --- --- --- 94.1 99.3 100.0 -3.2 6.3
* Includes pediatric subjects 7-17 years of age; no YSI measurements were taken for
pediatric subjects 2-6 years of age.
1
CGM readings are within 40-400 mg/dL, inclusive.
128