Now121110
40
70
250
400
3 Hours 6 12 24
4
5
6
7
8
9
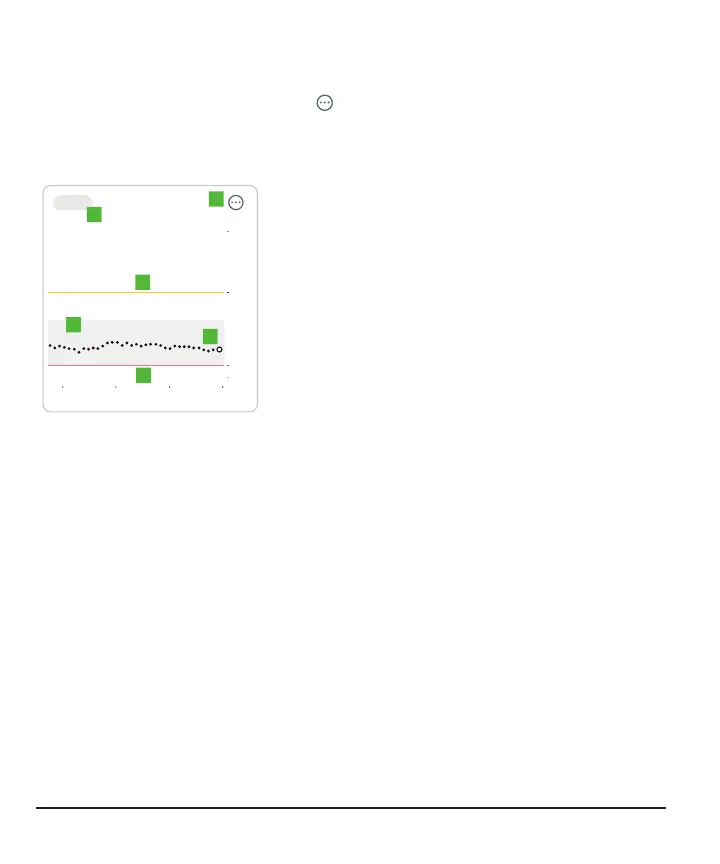
4.
3 Hours, 6, 12, 24: Change the number of
hours shown on the trend graph.
5.
: The three dots is the More button. It gives
you quick access to change alert levels and
choose a Quiet Mode.
6.
Trend graph: The bigger dot on the right is the
most recent sensor reading. The smaller dots
show past readings.
7.
Target range (shaded rectangle inside
graph): 70–180mg/dL is the international
consensus for recommended target range.
Change the target range in Profile > Glucose
tab.
8.
High alert yellow line: You get your High alert
when your glucose is at or above this yellow
line. Change level in Profile > Alerts > High
9.
Low alert red line: You get your Low alert
when your glucose is at or below this red line.
Change level in Profile > Alerts > Low
Consider using the receiver if you're more comfortable with a dedicated medical
device. On the phone, the G7 may compete with other apps for battery and storage
capacity and may require certain phone settings to function. The receiver doesn't have
these limitations.
26