3 • Display Device Screens | Dexcom G7 User Guide 27
Receiver
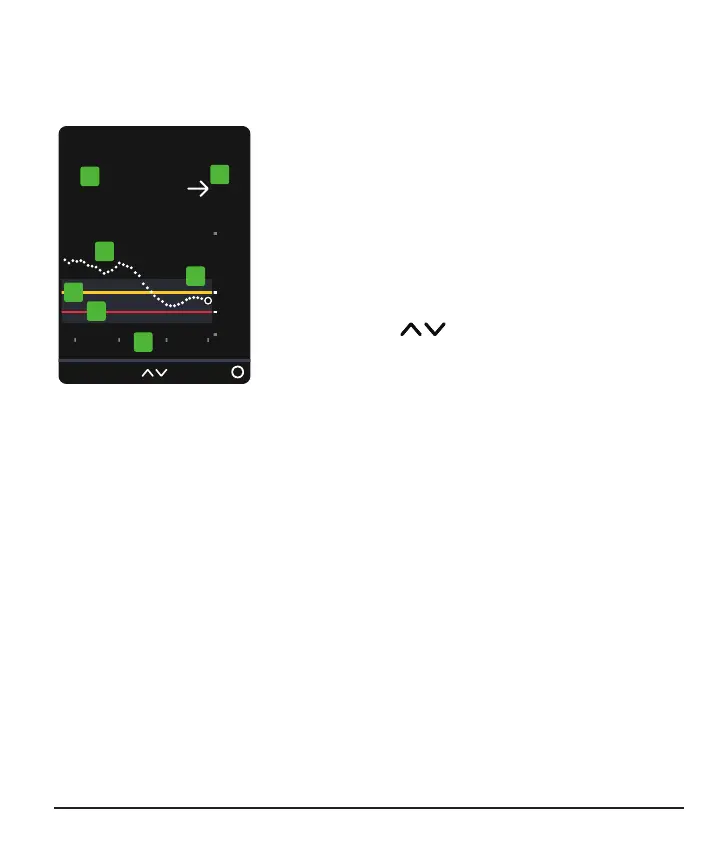
The receiver home screen shows your current glucose information. In the receiver, go
to Menu > Help for more information.
1.
Number: The most recent sensor reading.
2.
Trend arrow: Where glucose is heading based
on the last few readings.
3.
Trend graph: The bigger dot on the right is the
most recent sensor reading. The smaller dots
show past readings.
4.
3 Hours Change the number of hours
shown on the trend graph using the arrow
buttons.
5.
Target range (shaded rectangle inside graph): 70–180mg/dL is the
international consensus for recommended target range.
6. High alert yellow line: You get your High alert when your glucose is at or above
this yellow line. Change level in Menu > Settings > Alerts > High
7.
Low alert red line: You get your Low alert when your glucose is at or below this
red line. Change level in Menu > Settings > Alerts > Low