What Followers see
Each Follower sees only what the Sharer chooses to share.
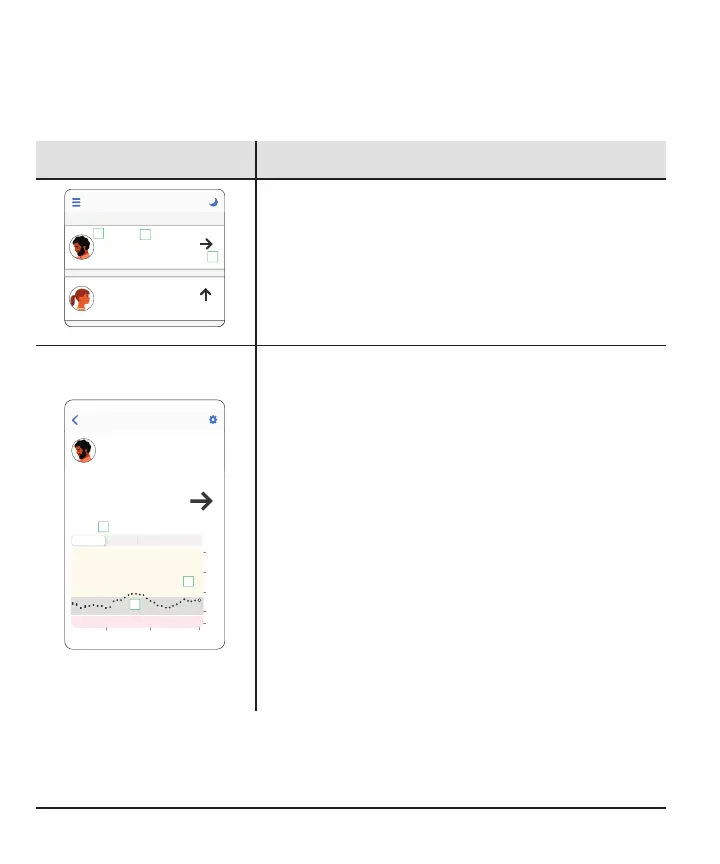
What Followers see
When Sharer shares
Follow
Jake
mg/dL
3m ago
165
Jane
mg/dL
3m ago
45
1
2
3
Sensor reading and trend arrow
1. Picture and Name of Sharer
2. Number: The most recent sensor reading
3. Trend arrow: Where glucose is heading based
on the last few readings
Follow
40
98
Now
100
400
200
300
Jake
Sensor reading, trend arrow, and trend graph
The above fields plus:
1. 3Hours, 6, 12, 24: Change the number of hours
shown on the trend graph.
2. Trend graph: The bigger dot on the right is the
most recent sensor reading. The smaller dots
show past readings.
3.
Target range (shaded rectangle inside
graph): 70–180mg/dL is the international
consensus for recommended target range.
Followers can set their own levels for the
notifications. They can get notifications for Urgent
Low, Low, High, or No Data. The Urgent Low
notification is always set at 55mg/dL.
76