M3A Vital Signs Monitor User Manual Introduction
- 16 -
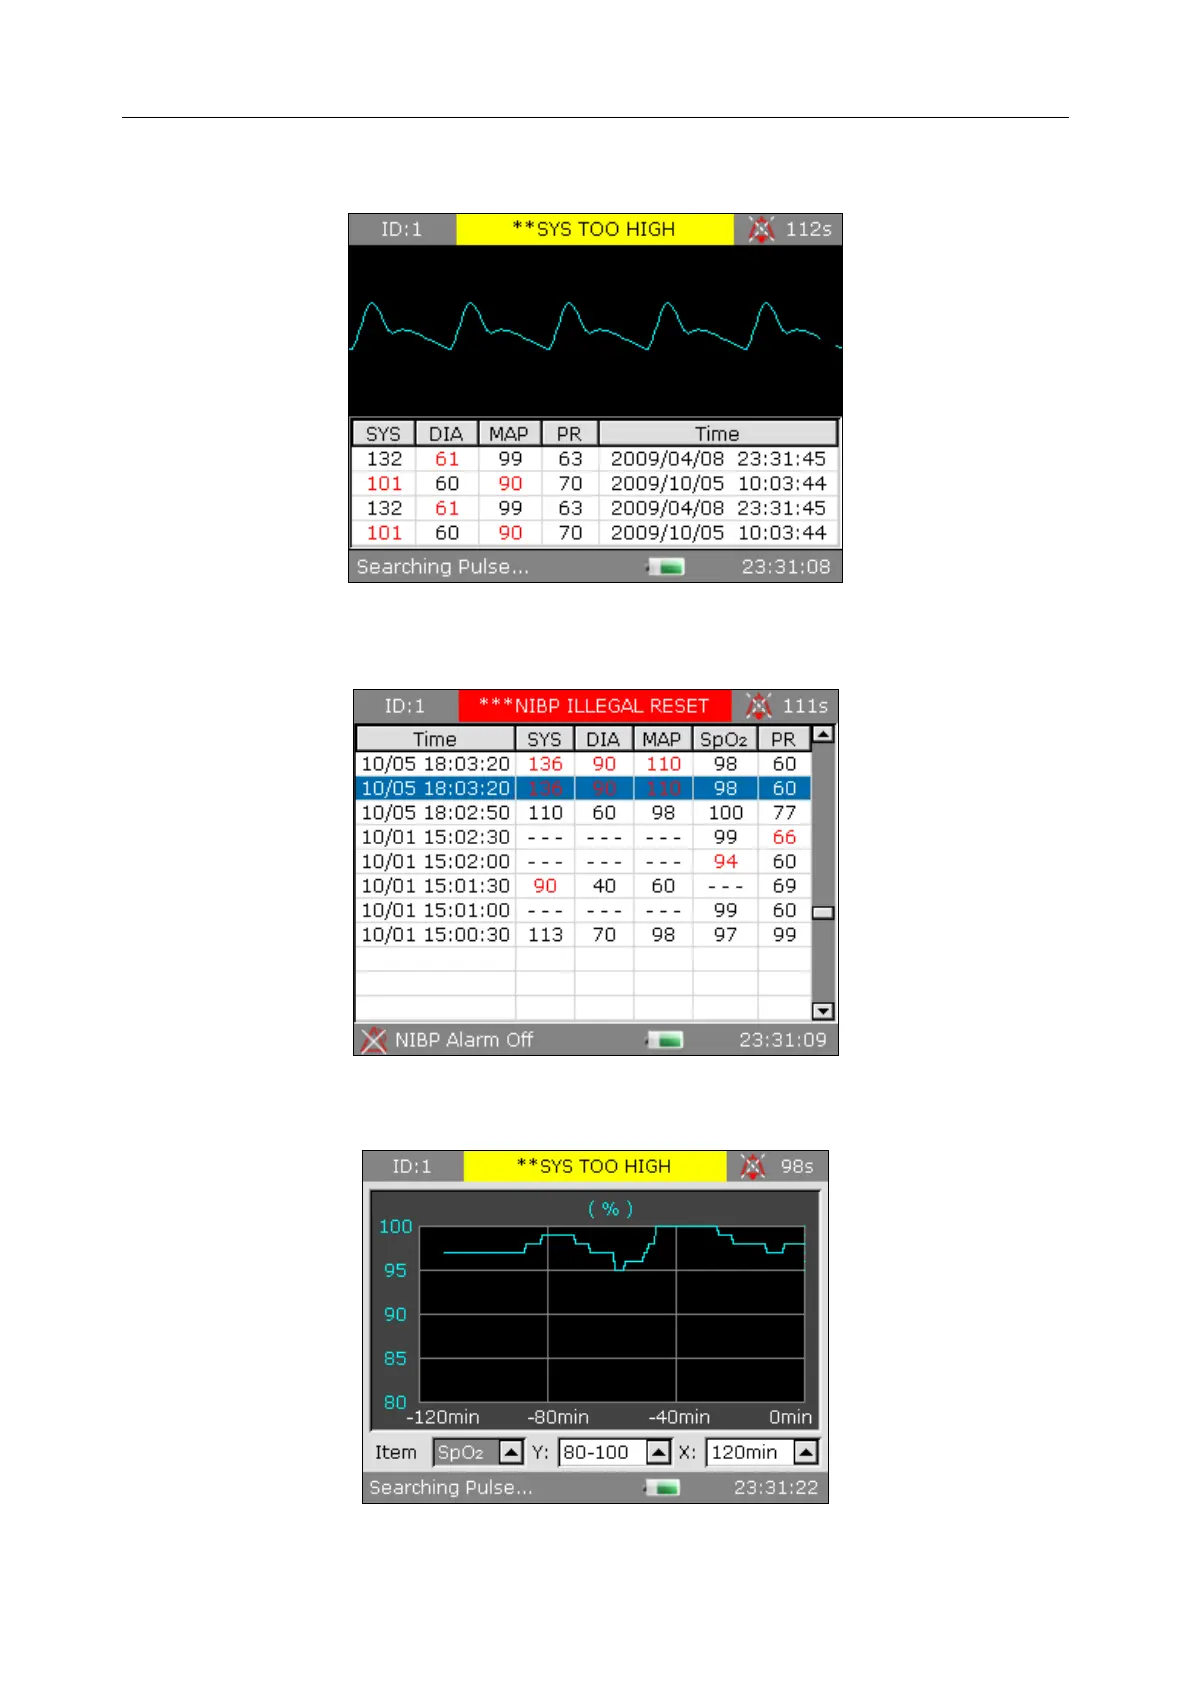
The NIBP multi-group Review and SpO
2
waveform area is displayed as follows:
Figure 3-3 NIBP Multi-group Review
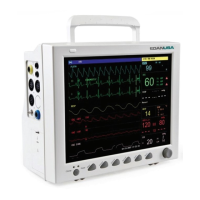
Change the display on the screen to trend list as follows:
Figure 3-4 Display Trend List
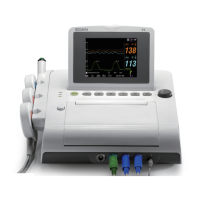
Change the display on the screen to trend graph as follows:
Figure 3-5 Display SpO
2
Trend Graph