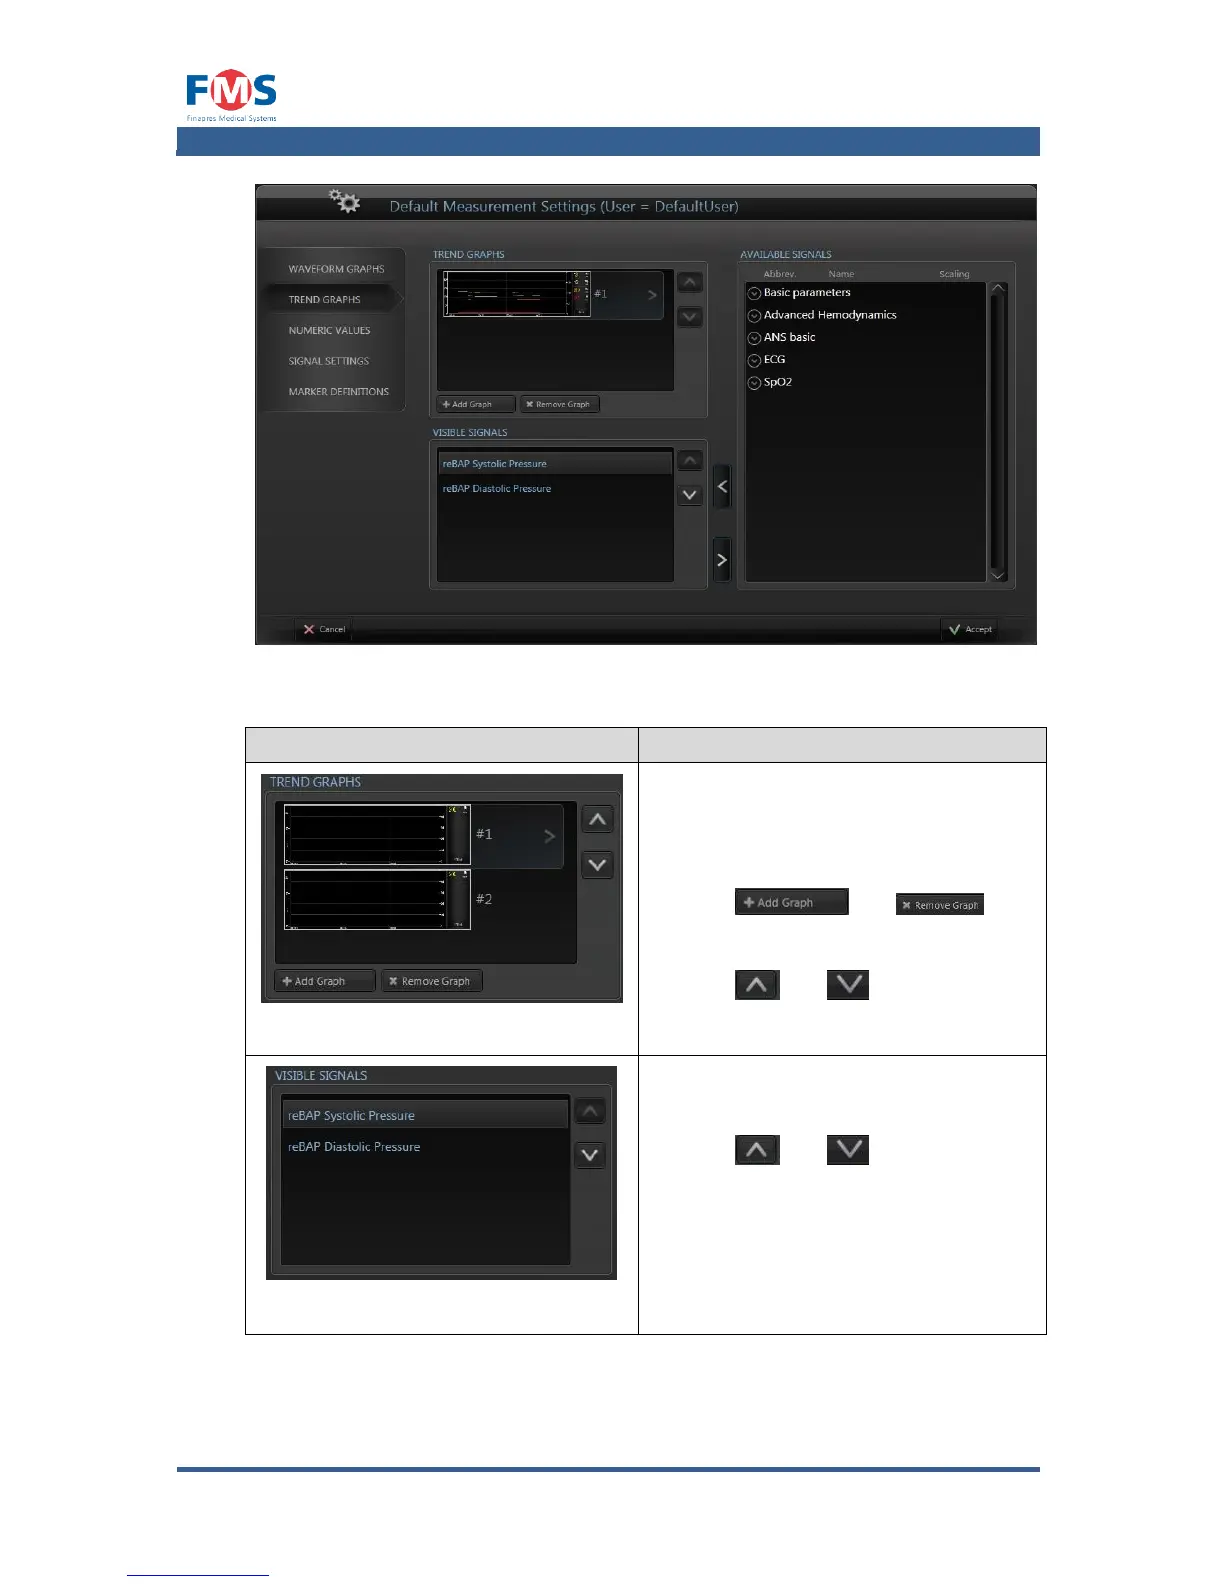
Shows the different trend graphs that
will be visible on the MEASUREMENT
SCREEN and REVIEW MEASUREMENT
SCREEN.
With the and
buttons it is possible to add a graph to
the screen.
With the and buttons it is
possible to change the position of the
graph on the screens.
Shows the different signals the will be
shown in the selected trend graph.
With the and buttons it is
possible to change the order of the y-
scales on the left side of the graphs (the
amount of different y-scales is limited to
three, when more signals with different
scaling settings are visible the lower
ones will not have their y-scale available
on the screen).